
- Start >
- Rivers >
- Waterlevel >
- Unterer Main >
- Oberthulba >
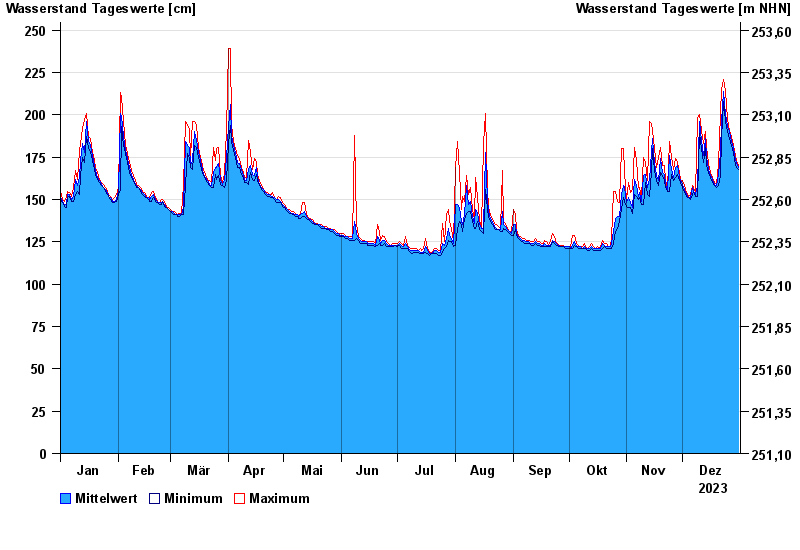
- Chart of year

Chart of year Oberthulba / Thulba
Waterlevel from 01.01.2023 to 31.12.2023
- 03.01.2003 Wasserstand: 295 cm
- 07.02.1984 Wasserstand: 292 cm
- 23.01.1995 Wasserstand: 290 cm
- 13.01.2011 Wasserstand: 268 cm
- 21.01.2005 Wasserstand: 266 cm
| Date | Mean value [cm] | Maximum [cm] | Minimum [cm] |
|---|---|---|---|
| 31.12.2023 | 169 | 170 | 168 |
| 30.12.2023 | 171 | 173 | 169 |
| 29.12.2023 | 176 | 179 | 173 |
| 28.12.2023 | 181 | 182 | 178 |
| 27.12.2023 | 184 | 187 | 182 |
| 26.12.2023 | 190 | 191 | 186 |
| 25.12.2023 | 193 | 197 | 190 |
© Bayerisches Landesamt für Umwelt 2024