
- Start >
- Rivers >
- Waterlevel >
- Unterer Main >
- Oberthulba >
- Chart of month

Chart of month Oberthulba / Thulba
Waterlevel from 01.02.2024 to 29.02.2024
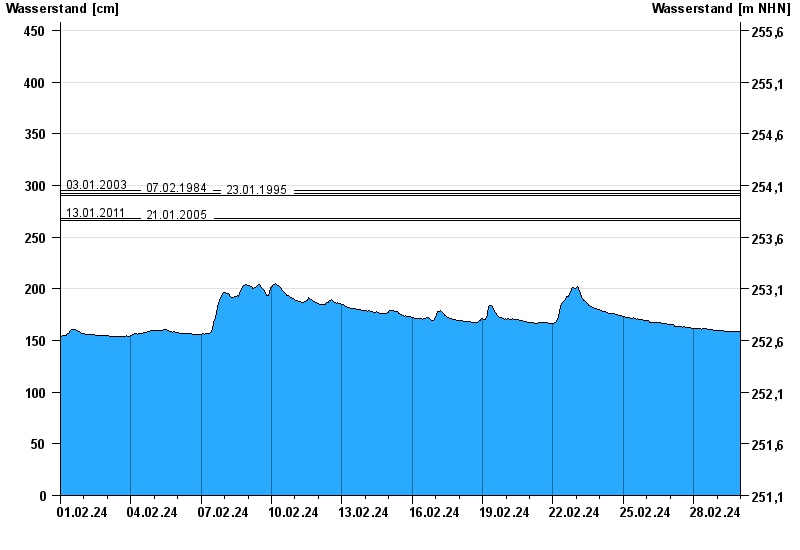
- 03.01.2003 Wasserstand: 295 cm
- 07.02.1984 Wasserstand: 292 cm
- 23.01.1995 Wasserstand: 290 cm
- 13.01.2011 Wasserstand: 268 cm
- 21.01.2005 Wasserstand: 266 cm
| Date | Waterlevel [cm] |
|---|---|
| 29.02.2024 23:45 | 158 |
| 29.02.2024 23:30 | 158 |
| 29.02.2024 23:15 | 159 |
| 29.02.2024 23:00 | 159 |
| 29.02.2024 22:45 | 159 |
| 29.02.2024 22:30 | 159 |
| 29.02.2024 22:15 | 159 |
© Bayerisches Landesamt für Umwelt 2024