
- Start >
- Rivers >
- Waterlevel >
- Unterer Main >
- Obernau >
- Chart of total period

Chart of total period Obernau / Main
Waterlevel from 28.10.1963 to 01.05.2024
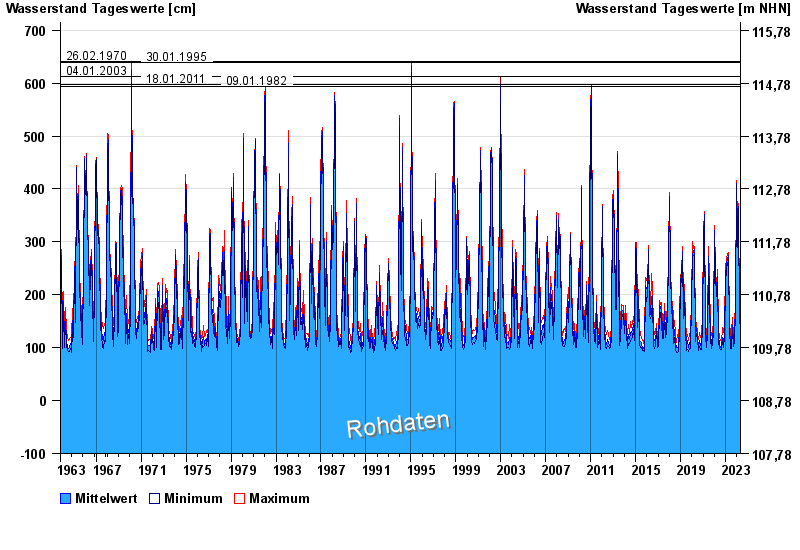
- 26.02.1970 Wasserstand: 641 cm
- 30.01.1995 Wasserstand: 639 cm
- 04.01.2003 Wasserstand: 612 cm
- 18.01.2011 Wasserstand: 598 cm
- 09.01.1982 Wasserstand: 593 cm
| Date | Mean value [cm] | Maximum [cm] | Minimum [cm] |
|---|---|---|---|
| 01.05.2024 | 126 | 129 | 123 |
| 30.04.2024 | 126 | 142 | 112 |
| 29.04.2024 | 130 | 141 | 122 |
| 28.04.2024 | 132 | 142 | 124 |
| 27.04.2024 | 136 | 144 | 129 |
| 26.04.2024 | 143 | 158 | 128 |
| 25.04.2024 | 151 | 159 | 129 |
© Bayerisches Landesamt für Umwelt 2024