
- Start >
- Rivers >
- Waterlevel >
- Unterer Main >
- Laubendorf >
- Chart of year

Chart of year Laubendorf / Zenn
Waterlevel from 30.03.2024 to 29.03.2025
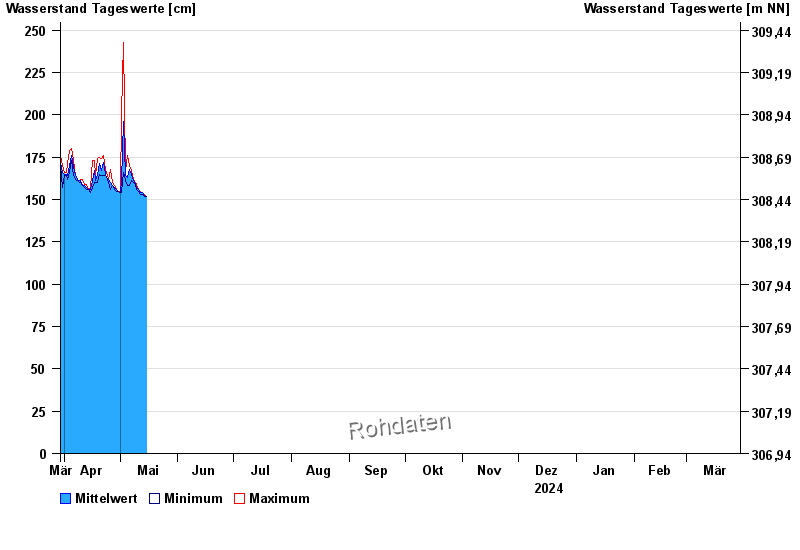
| Date | Mean value [cm] | Maximum [cm] | Minimum [cm] |
|---|---|---|---|
| 29.04.2024 | 156 | 156 | 156 |
| 28.04.2024 | 157 | 158 | 156 |
| 27.04.2024 | 158 | 160 | 158 |
| 26.04.2024 | 160 | 168 | 156 |
| 25.04.2024 | 162 | 162 | 160 |
| 24.04.2024 | 162 | 164 | 162 |
| 23.04.2024 | 165 | 168 | 164 |
© Bayerisches Landesamt für Umwelt 2024