
- Start >
- Rivers >
- Waterlevel >
- Unterer Main >
- Laubendorf >
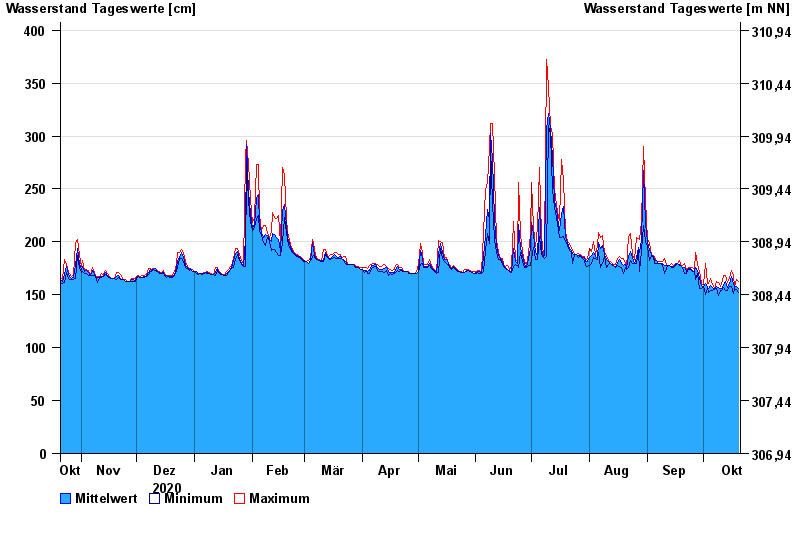
- Chart of year

Chart of year Laubendorf / Zenn
Waterlevel from 21.10.2020 to 20.10.2021
| Date | Mean value [cm] | Maximum [cm] | Minimum [cm] |
|---|---|---|---|
| 20.10.2021 | 156 | 163 | 152 |
| 19.10.2021 | 158 | 164 | 155 |
| 18.10.2021 | 157 | 158 | 156 |
| 17.10.2021 | 161 | 168 | 151 |
| 16.10.2021 | 167 | 173 | 158 |
| 15.10.2021 | 161 | 166 | 158 |
| 14.10.2021 | 157 | 162 | 154 |
© Bayerisches Landesamt für Umwelt 2024