
- Start >
- Rivers >
- Waterlevel >
- Unterer Main >
- Heinersdorf >
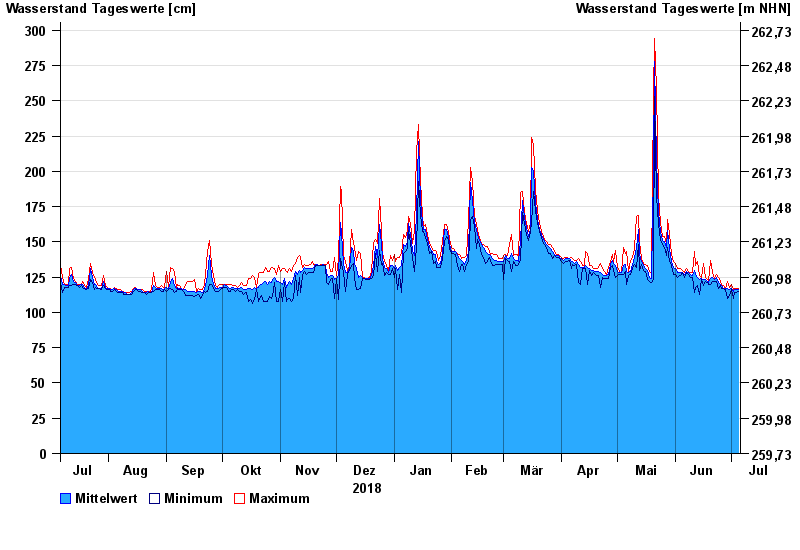
- Chart of year

Chart of year Heinersdorf / Rodach
Waterlevel from 06.07.2018 to 05.07.2019
| Date | Mean value [cm] | Maximum [cm] | Minimum [cm] |
|---|---|---|---|
| 05.07.2019 | 116 | 117 | 115 |
| 04.07.2019 | 116 | 117 | 114 |
| 03.07.2019 | 116 | 117 | 114 |
| 02.07.2019 | 115 | 116 | 110 |
| 01.07.2019 | 117 | 120 | 116 |
| 30.06.2019 | 116 | 118 | 112 |
| 29.06.2019 | 117 | 122 | 110 |
© Bayerisches Landesamt für Umwelt 2024