
- Start >
- Rivers >
- Waterlevel >
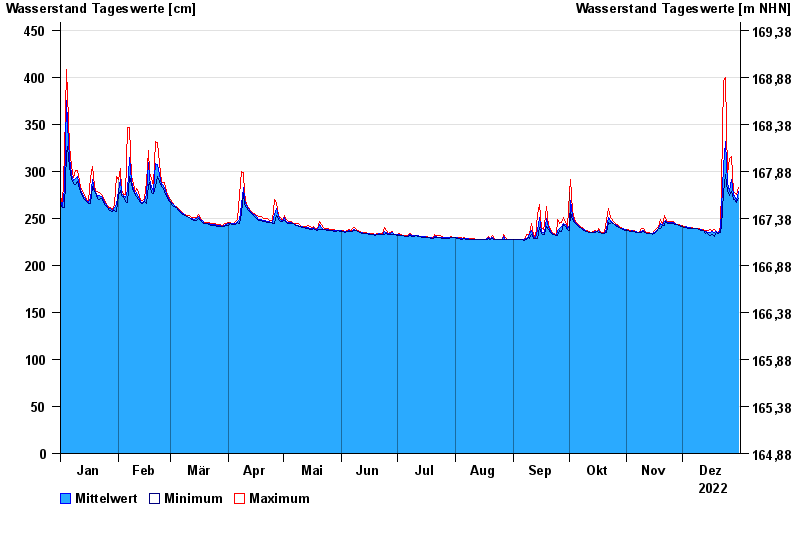
- Unterer Main >
- Gräfendorf >
- Chart of year

Chart of year Gräfendorf / Schondra
Waterlevel from 01.01.2022 to 31.12.2022
| Date | Mean value [cm] | Maximum [cm] | Minimum [cm] |
|---|---|---|---|
| 31.12.2022 | 278 | 283 | 271 |
| 30.12.2022 | 269 | 275 | 267 |
| 29.12.2022 | 274 | 277 | 270 |
| 28.12.2022 | 274 | 279 | 270 |
| 27.12.2022 | 291 | 316 | 279 |
| 26.12.2022 | 279 | 314 | 274 |
| 25.12.2022 | 287 | 297 | 278 |
© Bayerisches Landesamt für Umwelt 2024