
- Start >
- Rivers >
- Waterlevel >
- Unterer Main >
- Faulbach >
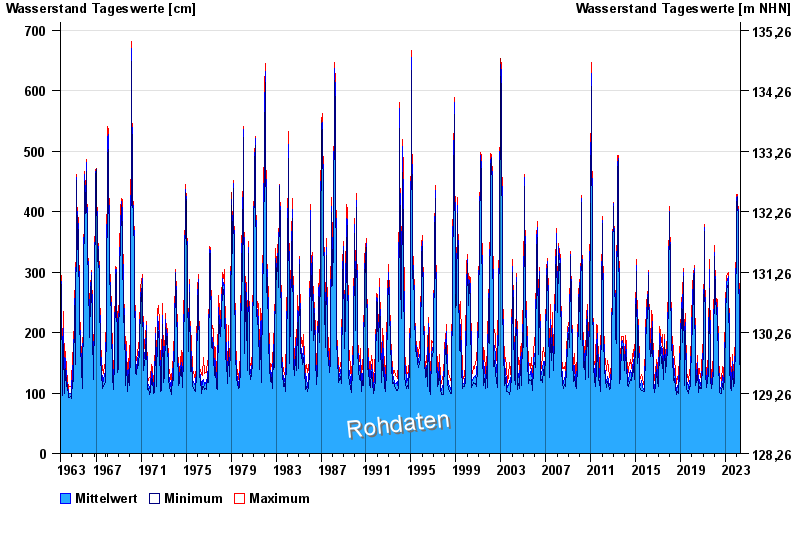
- Chart of total period

Chart of total period Faulbach / Main
Waterlevel from 28.10.1963 to 26.04.2024
| Date | Mean value [cm] | Maximum [cm] | Minimum [cm] |
|---|---|---|---|
| 26.04.2024 | 153 | 159 | 144 |
| 25.04.2024 | 154 | 165 | 130 |
| 24.04.2024 | 163 | 176 | 150 |
| 23.04.2024 | 175 | 182 | 168 |
| 22.04.2024 | 178 | 186 | 172 |
| 21.04.2024 | 161 | 172 | 152 |
| 20.04.2024 | 144 | 155 | 132 |
© Bayerisches Landesamt für Umwelt 2024