
- Start >
- Rivers >
- Waterlevel >
- Unterer Main >
- Faulbach >
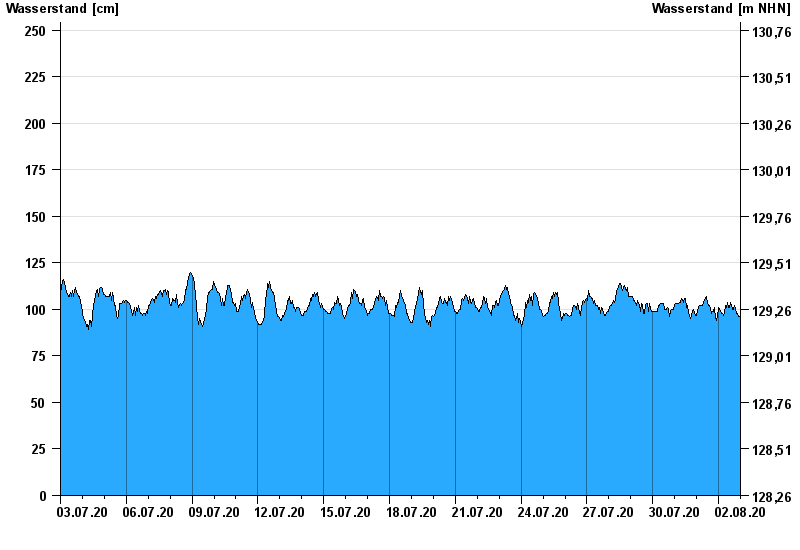
- Chart of month

Chart of month Faulbach / Main
Waterlevel from 03.07.2020 to 02.08.2020
- 26.02.1970 Wasserstand: 681 cm
- 30.01.1995 Wasserstand: 666 cm
- 04.01.2003 Wasserstand: 653 cm
- 29.03.1988 Wasserstand: 647 cm
- 17.01.2011 Wasserstand: 646 cm
| Date | Waterlevel [cm] |
|---|---|
| 03.08.2020 00:45 | 95 |
| 03.08.2020 00:30 | 95 |
| 03.08.2020 00:15 | 95 |
| 03.08.2020 00:00 | 95 |
| 02.08.2020 23:45 | 95 |
| 02.08.2020 23:30 | 95 |
| 02.08.2020 23:15 | 95 |
© Bayerisches Landesamt für Umwelt 2024