
- Start >
- Rivers >
- Waterlevel >
- Unterer Main >
- Ettleben >
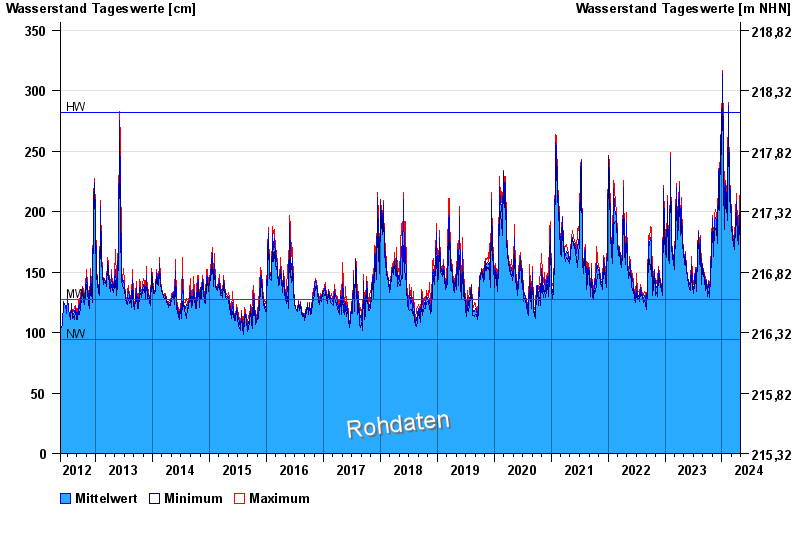
- Chart of total period

Chart of total period Ettleben / Wern
Waterlevel from 19.05.2012 to 28.04.2024
| Date | Mean value [cm] | Maximum [cm] | Minimum [cm] |
|---|---|---|---|
| 28.04.2024 | 166 | 168 | 164 |
| 27.04.2024 | 169 | 171 | 167 |
| 26.04.2024 | 172 | 175 | 171 |
| 25.04.2024 | 176 | 177 | 175 |
| 24.04.2024 | 177 | 180 | 174 |
| 23.04.2024 | 184 | 190 | 180 |
| 22.04.2024 | 199 | 211 | 190 |
© Bayerisches Landesamt für Umwelt 2024