
- Start >
- Rivers >
- Waterlevel >
- Unterer Main >
- Bruckberg >
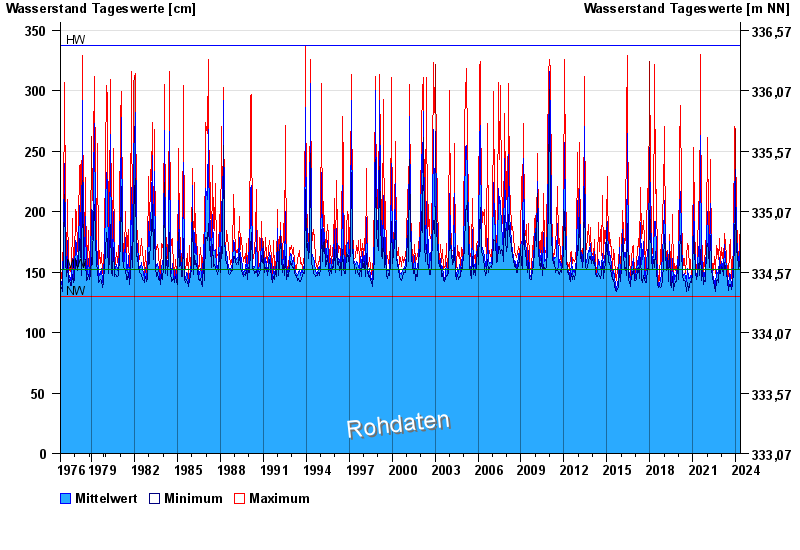
- Chart of total period

Chart of total period Bruckberg / Haselbach
Waterlevel from 01.11.1976 to 02.05.2024
| Date | Mean value [cm] | Maximum [cm] | Minimum [cm] |
|---|---|---|---|
| 02.05.2024 | 143 | 145 | 142 |
| 01.05.2024 | 143 | 143 | 142 |
| 30.04.2024 | 144 | 147 | 143 |
| 29.04.2024 | 144 | 145 | 144 |
| 28.04.2024 | 145 | 145 | 145 |
| 27.04.2024 | 145 | 145 | 145 |
| 26.04.2024 | 146 | 148 | 145 |
© Bayerisches Landesamt für Umwelt 2024