
- Start >
- Rivers >
- Waterlevel >
- Unterer Main >
- Bieberehren >
- Chart of total period

Chart of total period Bieberehren / Gollach
Waterlevel from 01.11.1969 to 26.04.2024
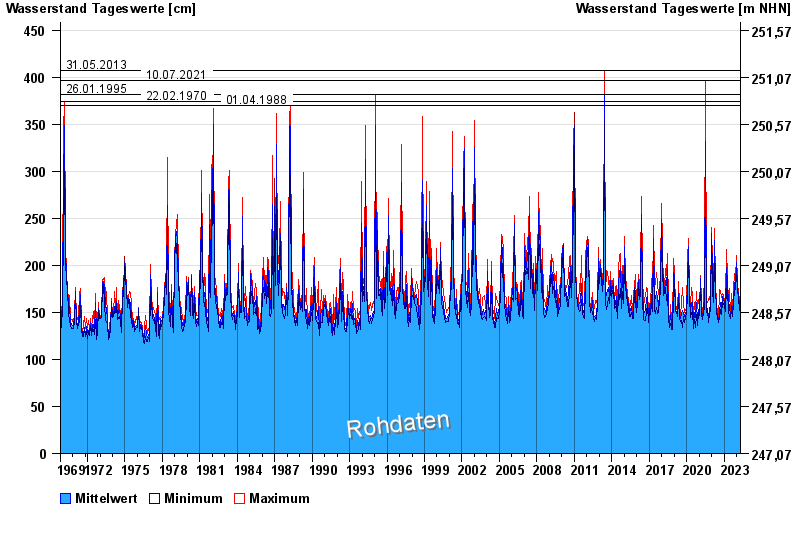
- 31.05.2013 Wasserstand: 407 cm
- 10.07.2021 Wasserstand: 397 cm
- 26.01.1995 Wasserstand: 382 cm
- 22.02.1970 Wasserstand: 374 cm
- 01.04.1988 Wasserstand: 370 cm
| Date | Mean value [cm] | Maximum [cm] | Minimum [cm] |
|---|---|---|---|
| 26.04.2024 | 149 | 149 | 149 |
| 25.04.2024 | 149 | 150 | 149 |
| 24.04.2024 | 149 | 149 | 148 |
| 23.04.2024 | 150 | 151 | 149 |
| 22.04.2024 | 153 | 154 | 151 |
| 21.04.2024 | 151 | 153 | 151 |
| 20.04.2024 | 154 | 157 | 151 |
© Bayerisches Landesamt für Umwelt 2024