
- Start >
- Rivers >
- Waterlevel >
- Unterer Main >
- Bad Königshofen im Grabfeld >
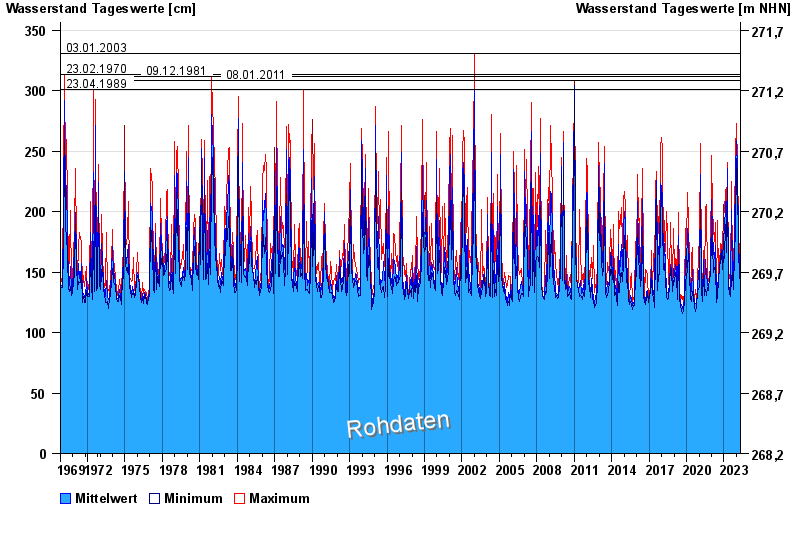
- Chart of total period

Chart of total period Bad Königshofen im Grabfeld / Fränkische Saale
Waterlevel from 01.11.1969 to 27.04.2024
note
Biberaktivität: Werte können durch Aufstau beeinflusst sein
- 03.01.2003 Wasserstand: 331 cm
- 23.02.1970 Wasserstand: 313 cm
- 09.12.1981 Wasserstand: 312 cm
- 08.01.2011 Wasserstand: 308 cm
- 23.04.1989 Wasserstand: 301 cm
| Date | Mean value [cm] | Maximum [cm] | Minimum [cm] |
|---|---|---|---|
| 27.04.2024 | 136 | 136 | 136 |
| 26.04.2024 | 137 | 137 | 136 |
| 25.04.2024 | 136 | 137 | 135 |
| 24.04.2024 | 138 | 138 | 135 |
| 23.04.2024 | 139 | 142 | 138 |
| 22.04.2024 | 142 | 144 | 140 |
| 21.04.2024 | 147 | 160 | 138 |
© Bayerisches Landesamt für Umwelt 2024