
- Start >
- Rivers >
- Waterlevel >
- Unterer Main >
- Bad Brückenau >
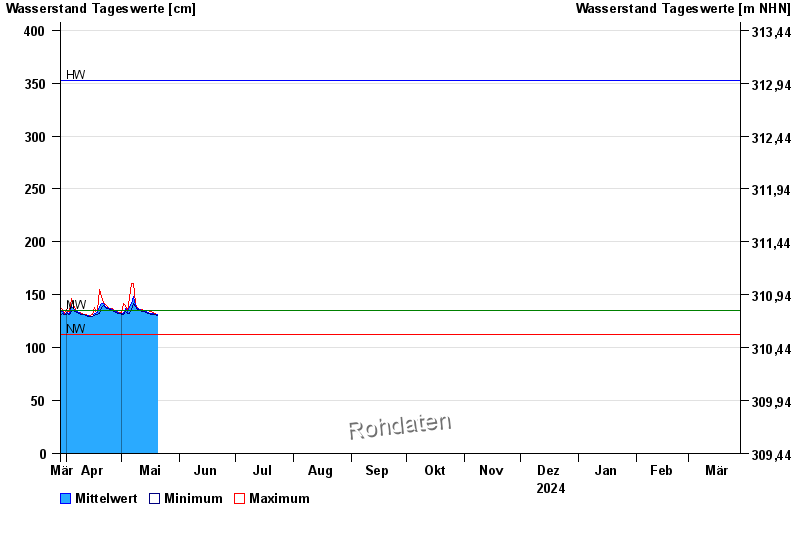
- Chart of year

Chart of year Bad Brückenau / Sinn
Waterlevel from 29.03.2024 to 28.03.2025
| Date | Mean value [cm] | Maximum [cm] | Minimum [cm] |
|---|---|---|---|
| 16.06.2024 | 126 | 126 | 126 |
| 15.06.2024 | 127 | 129 | 125 |
| 14.06.2024 | 126 | 126 | 125 |
| 13.06.2024 | 126 | 126 | 125 |
| 12.06.2024 | 126 | 126 | 125 |
| 11.06.2024 | 126 | 127 | 126 |
| 10.06.2024 | 126 | 127 | 126 |
© Bayerisches Landesamt für Umwelt 2024