
- Start >
- Rivers >
- Waterlevel >
- Unterer Main >
- Bad Brückenau >
- Chart of total period

Chart of total period Bad Brückenau / Sinn
Waterlevel from 01.11.1963 to 19.04.2024
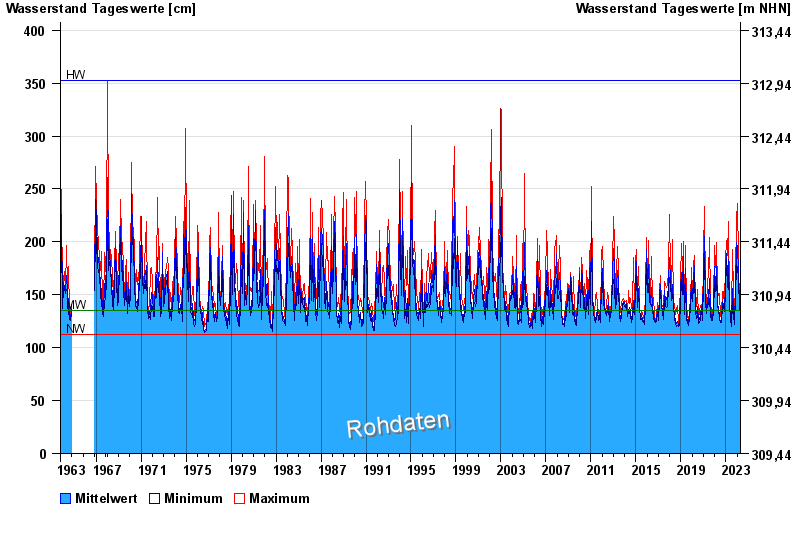
| Date | Mean value [cm] | Maximum [cm] | Minimum [cm] |
|---|---|---|---|
| 19.04.2024 | 133 | 136 | 132 |
| 18.04.2024 | 133 | 135 | 131 |
| 17.04.2024 | 132 | 134 | 131 |
| 16.04.2024 | 132 | 138 | 130 |
| 15.04.2024 | 129 | 131 | 129 |
| 14.04.2024 | 129 | 130 | 129 |
| 13.04.2024 | 130 | 130 | 129 |
© Bayerisches Landesamt für Umwelt 2024