
- Start >
- Rivers >
- Waterlevel >
- Unterer Main >
- Bad Brückenau >
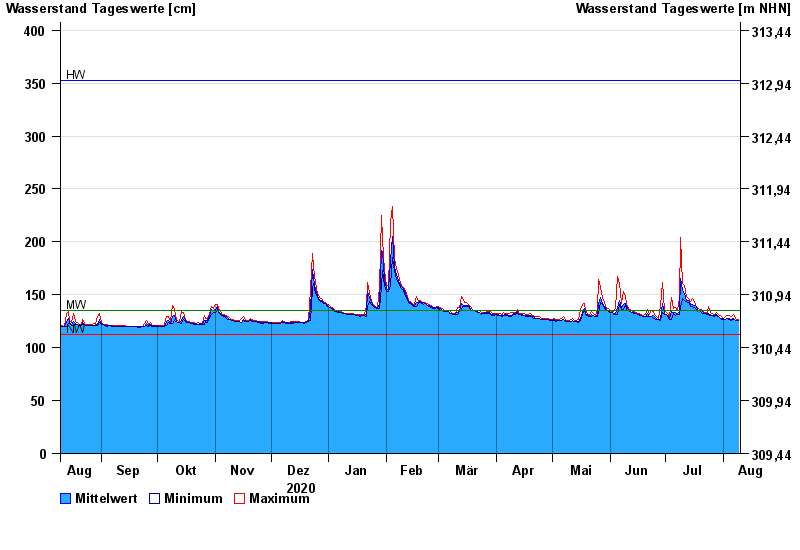
- Chart of year

Chart of year Bad Brückenau / Sinn
Waterlevel from 10.08.2020 to 09.08.2021
| Date | Mean value [cm] | Maximum [cm] | Minimum [cm] |
|---|---|---|---|
| 09.08.2021 | 126 | 127 | 126 |
| 08.08.2021 | 126 | 127 | 126 |
| 07.08.2021 | 127 | 129 | 127 |
| 06.08.2021 | 128 | 131 | 127 |
| 05.08.2021 | 127 | 129 | 126 |
| 04.08.2021 | 128 | 130 | 127 |
| 03.08.2021 | 128 | 130 | 128 |
© Bayerisches Landesamt für Umwelt 2024