
- Start >
- Rivers >
- Waterlevel >
- Unterer Main >
- Amorbach >
- Chart of year

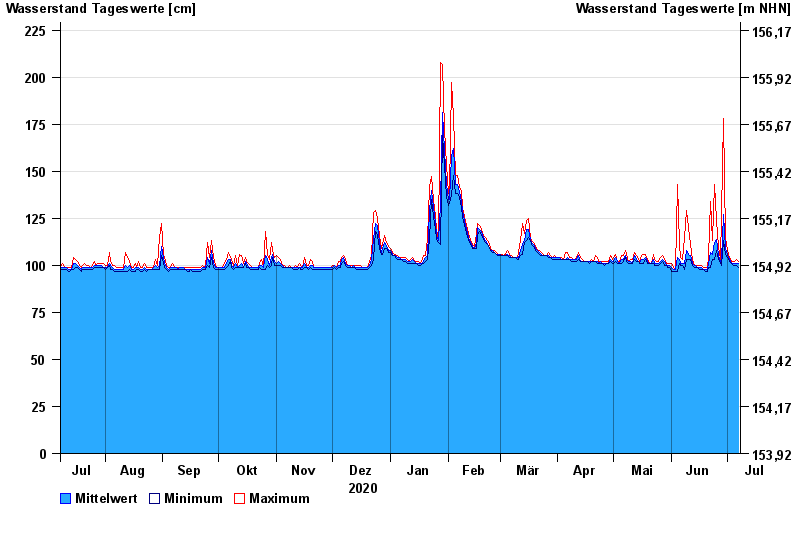
Chart of year Amorbach / Billbach
Waterlevel from 08.07.2020 to 07.07.2021
- 04.02.2020 Wasserstand: 319 cm
- 05.01.2018 Wasserstand: 278 cm
- 03.01.2018 Wasserstand: 262 cm
- 01.06.2013 Wasserstand: 262 cm
- 04.01.2022 Wasserstand: 248 cm
| Date | Mean value [cm] | Maximum [cm] | Minimum [cm] |
|---|---|---|---|
| 07.07.2021 | 101 | 102 | 99 |
| 06.07.2021 | 101 | 103 | 100 |
| 05.07.2021 | 101 | 102 | 100 |
| 04.07.2021 | 101 | 102 | 100 |
| 03.07.2021 | 101 | 102 | 101 |
| 02.07.2021 | 103 | 104 | 102 |
| 01.07.2021 | 106 | 108 | 104 |
© Bayerisches Landesamt für Umwelt 2024