
- Start >
- Rivers >
- Waterlevel >
- Obere Donau >
- Winkl >
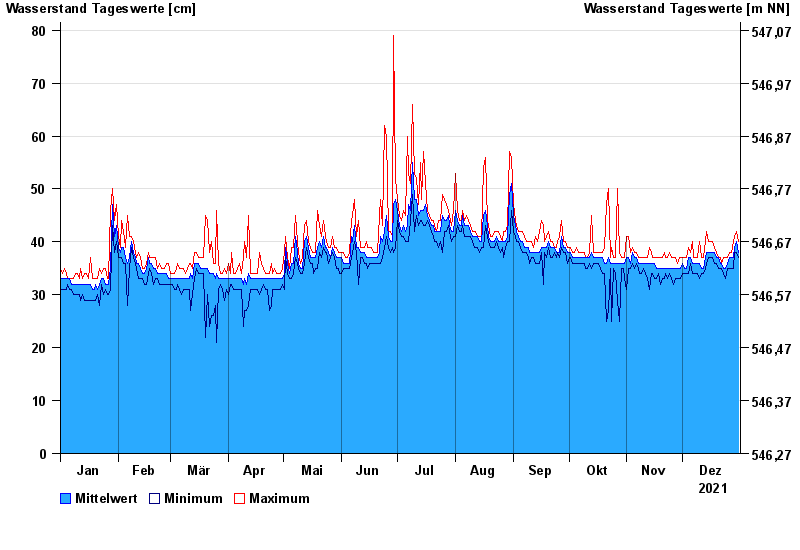
- Chart of year

Chart of year Winkl / Verlorener Bach
Waterlevel from 01.01.2021 to 31.12.2021
note
Messwerte beeinflusst durch Kraftwerkssteuerungen.
- 10.03.2006 Wasserstand: 128 cm
- 06.06.2011 Wasserstand: 127 cm
- 19.05.2002 Wasserstand: 126 cm
- 22.05.1999 Wasserstand: 122 cm
- 06.08.2000 Wasserstand: 111 cm
| Date | Mean value [cm] | Maximum [cm] | Minimum [cm] |
|---|---|---|---|
| 31.12.2021 | 38 | 40 | 37 |
| 30.12.2021 | 40 | 42 | 38 |
| 29.12.2021 | 39 | 41 | 38 |
| 28.12.2021 | 37 | 40 | 35 |
| 27.12.2021 | 37 | 38 | 35 |
| 26.12.2021 | 37 | 38 | 35 |
| 25.12.2021 | 36 | 37 | 35 |
© Bayerisches Landesamt für Umwelt 2024