
- Start >
- Rivers >
- Waterlevel >
- Obere Donau >
- Wiblingen >
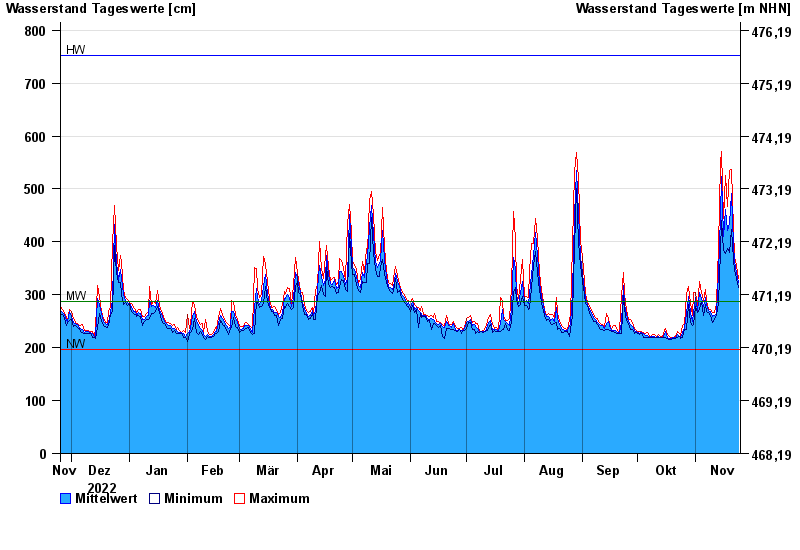
- Chart of year

Chart of year Wiblingen / Iller
Waterlevel from 25.11.2022 to 24.11.2023
| Date | Mean value [cm] | Maximum [cm] | Minimum [cm] |
|---|---|---|---|
| 24.11.2023 | 324 | 331 | 314 |
| 23.11.2023 | 342 | 355 | 331 |
| 22.11.2023 | 362 | 371 | 345 |
| 21.11.2023 | 395 | 424 | 367 |
| 20.11.2023 | 492 | 536 | 424 |
| 19.11.2023 | 435 | 534 | 380 |
| 18.11.2023 | 421 | 466 | 388 |
© Bayerisches Landesamt für Umwelt 2024