
- Start >
- Rivers >
- Waterlevel >
- Obere Donau >
- Wiblingen >
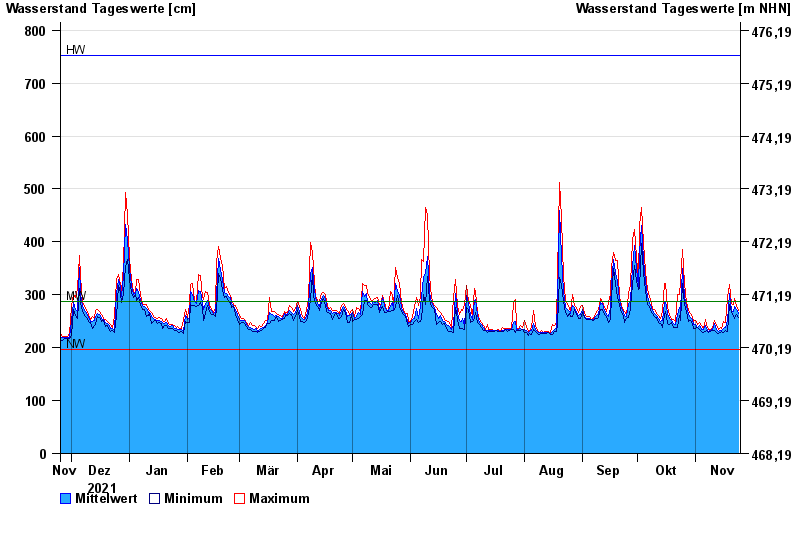
- Chart of year

Chart of year Wiblingen / Iller
Waterlevel from 25.11.2021 to 24.11.2022
| Date | Mean value [cm] | Maximum [cm] | Minimum [cm] |
|---|---|---|---|
| 24.11.2022 | 264 | 270 | 257 |
| 23.11.2022 | 272 | 279 | 263 |
| 22.11.2022 | 277 | 292 | 255 |
| 21.11.2022 | 268 | 282 | 259 |
| 20.11.2022 | 271 | 283 | 266 |
| 19.11.2022 | 302 | 320 | 282 |
| 18.11.2022 | 251 | 294 | 230 |
© Bayerisches Landesamt für Umwelt 2024