
- Start >
- Rivers >
- Waterlevel >
- Obere Donau >
- Wiblingen >
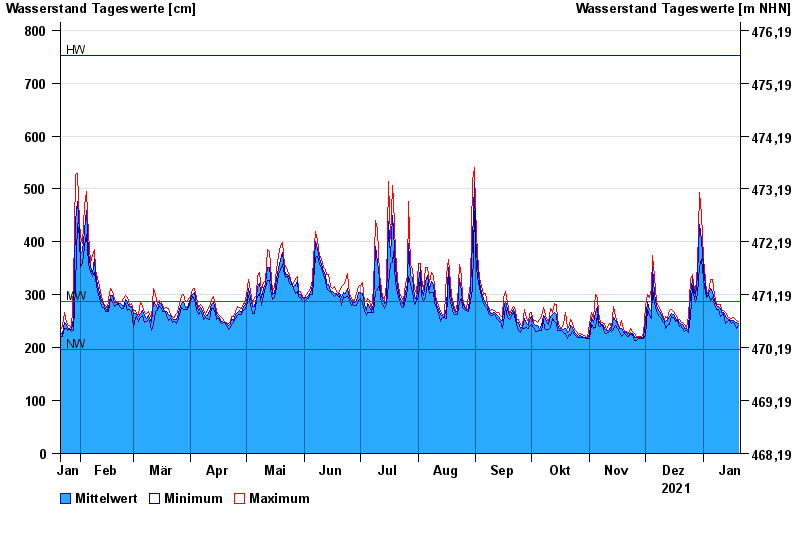
- Chart of year

Chart of year Wiblingen / Iller
Waterlevel from 21.01.2021 to 20.01.2022
| Date | Mean value [cm] | Maximum [cm] | Minimum [cm] |
|---|---|---|---|
| 20.01.2022 | 246 | 249 | 241 |
| 19.01.2022 | 247 | 252 | 237 |
| 18.01.2022 | 250 | 256 | 246 |
| 17.01.2022 | 251 | 257 | 247 |
| 16.01.2022 | 252 | 255 | 246 |
| 15.01.2022 | 254 | 257 | 252 |
| 14.01.2022 | 255 | 259 | 250 |
© Bayerisches Landesamt für Umwelt 2024