
- Start >
- Rivers >
- Waterlevel >
- Obere Donau >
- Wiblingen >
- Chart of year

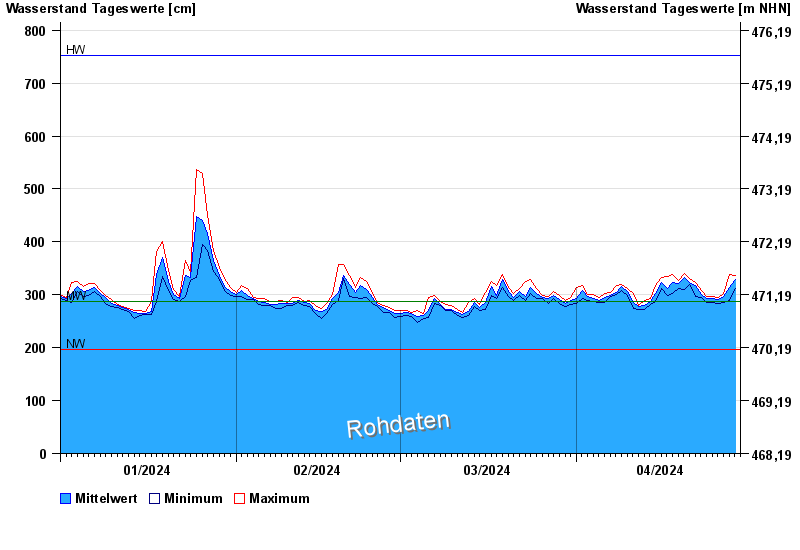
Chart of year Wiblingen / Iller
Waterlevel from 01.01.2024 to 29.04.2024
| Date | Mean value [cm] | Maximum [cm] | Minimum [cm] |
|---|---|---|---|
| 29.04.2024 | 329 | 337 | 312 |
| 28.04.2024 | 314 | 338 | 290 |
| 27.04.2024 | 296 | 303 | 285 |
| 26.04.2024 | 291 | 294 | 284 |
| 25.04.2024 | 293 | 297 | 286 |
| 24.04.2024 | 292 | 297 | 286 |
| 23.04.2024 | 300 | 308 | 294 |
© Bayerisches Landesamt für Umwelt 2024