
- Start >
- Rivers >
- Waterlevel >
- Obere Donau >
- Vohburg >
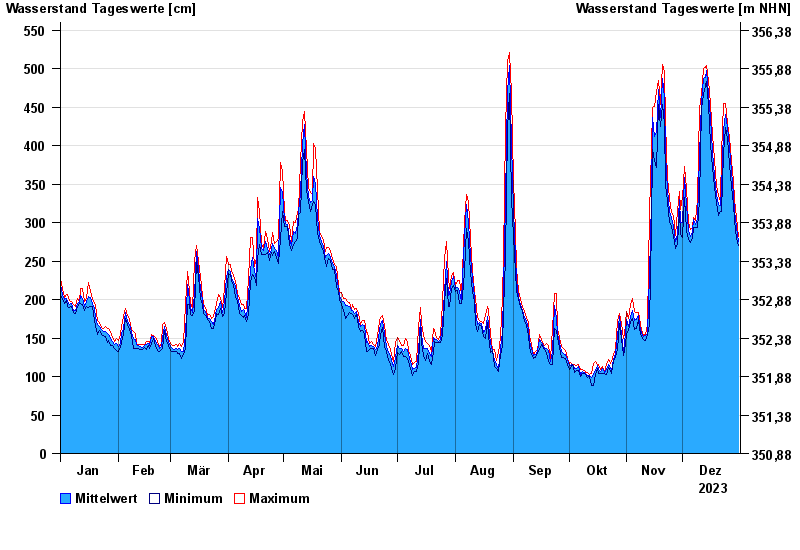
- Chart of year

Chart of year Vohburg / Donau
Waterlevel from 01.01.2023 to 31.12.2023
 Für diesen Pegel sind keine Hochwassermarken hinterlegt.
| Date | Mean value [cm] | Maximum [cm] | Minimum [cm] |
|---|---|---|---|
| 31.12.2023 | 276 | 282 | 270 |
| 30.12.2023 | 294 | 306 | 279 |
| 29.12.2023 | 314 | 330 | 303 |
| 28.12.2023 | 337 | 353 | 323 |
| 27.12.2023 | 367 | 381 | 347 |
| 26.12.2023 | 398 | 411 | 375 |
| 25.12.2023 | 423 | 429 | 409 |
© Bayerisches Landesamt für Umwelt 2024