
- Start >
- Rivers >
- Waterlevel >
- Obere Donau >
- Vohburg >
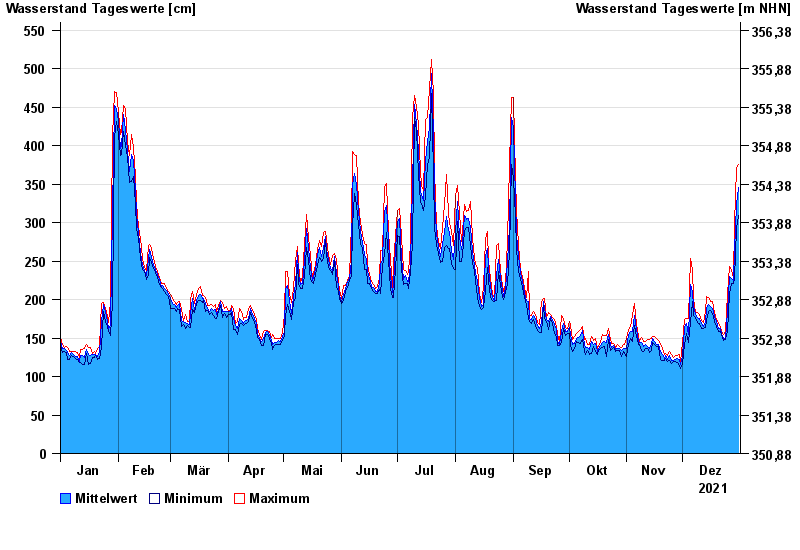
- Chart of year

Chart of year Vohburg / Donau
Waterlevel from 01.01.2021 to 31.12.2021
 Für diesen Pegel sind keine Meldestufen hinterlegt.
| Date | Mean value [cm] | Maximum [cm] | Minimum [cm] |
|---|---|---|---|
| 31.12.2021 | 346 | 375 | 309 |
| 30.12.2021 | 324 | 370 | 292 |
| 29.12.2021 | 264 | 299 | 228 |
| 28.12.2021 | 225 | 228 | 221 |
| 27.12.2021 | 228 | 238 | 221 |
| 26.12.2021 | 230 | 243 | 208 |
| 25.12.2021 | 184 | 208 | 159 |
© Bayerisches Landesamt für Umwelt 2024