
- Start >
- Rivers >
- Waterlevel >
- Obere Donau >
- Vohburg >
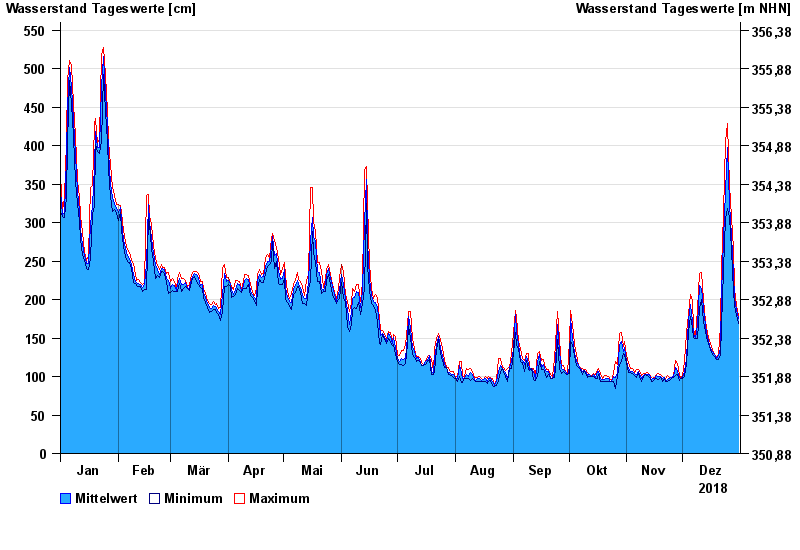
- Chart of year

Chart of year Vohburg / Donau
Waterlevel from 01.01.2018 to 31.12.2018
 Für diesen Pegel sind keine Hochwassermarken hinterlegt.
| Date | Mean value [cm] | Maximum [cm] | Minimum [cm] |
|---|---|---|---|
| 31.12.2018 | 175 | 179 | 169 |
| 30.12.2018 | 186 | 192 | 179 |
| 29.12.2018 | 202 | 215 | 192 |
| 28.12.2018 | 234 | 267 | 211 |
| 27.12.2018 | 283 | 307 | 265 |
| 26.12.2018 | 324 | 348 | 306 |
| 25.12.2018 | 398 | 429 | 318 |
© Bayerisches Landesamt für Umwelt 2024