
- Start >
- Rivers >
- Waterlevel >
- Obere Donau >
- Treuchtlingen >
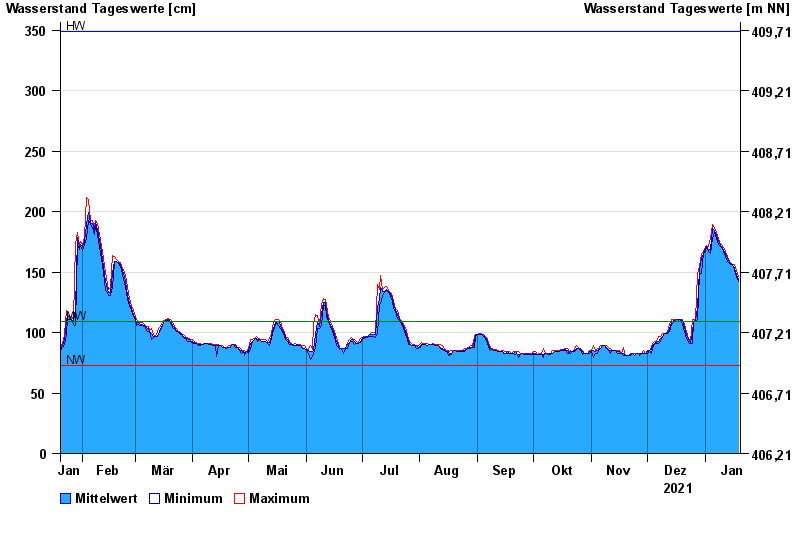
- Chart of year

Chart of year Treuchtlingen / Altmühl
Waterlevel from 20.01.2021 to 19.01.2022
| Date | Mean value [cm] | Maximum [cm] | Minimum [cm] |
|---|---|---|---|
| 19.01.2022 | 144 | 146 | 142 |
| 18.01.2022 | 148 | 151 | 146 |
| 17.01.2022 | 153 | 156 | 151 |
| 16.01.2022 | 155 | 156 | 155 |
| 15.01.2022 | 157 | 157 | 156 |
| 14.01.2022 | 158 | 159 | 157 |
| 13.01.2022 | 161 | 163 | 159 |
© Bayerisches Landesamt für Umwelt 2024