
- Start >
- Rivers >
- Waterlevel >
- Obere Donau >
- Treuchtlingen >
- Chart of year

Chart of year Treuchtlingen / Altmühl
Waterlevel from 15.07.2020 to 14.07.2021
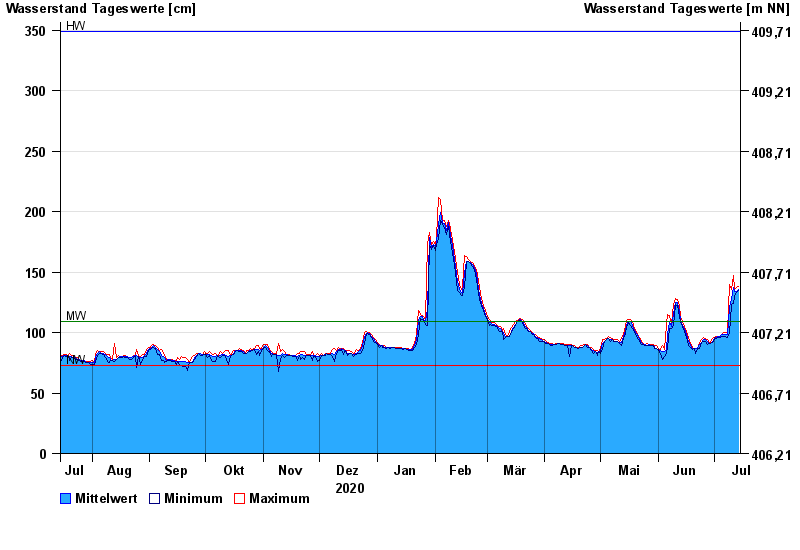
| Date | Mean value [cm] | Maximum [cm] | Minimum [cm] |
|---|---|---|---|
| 14.07.2021 | 136 | 138 | 135 |
| 13.07.2021 | 134 | 137 | 133 |
| 12.07.2021 | 134 | 136 | 130 |
| 11.07.2021 | 137 | 147 | 124 |
| 10.07.2021 | 127 | 136 | 123 |
| 09.07.2021 | 121 | 140 | 99 |
| 08.07.2021 | 98 | 100 | 96 |
© Bayerisches Landesamt für Umwelt 2024