
- Start >
- Rivers >
- Waterlevel >
- Obere Donau >
- Treuchtlingen >
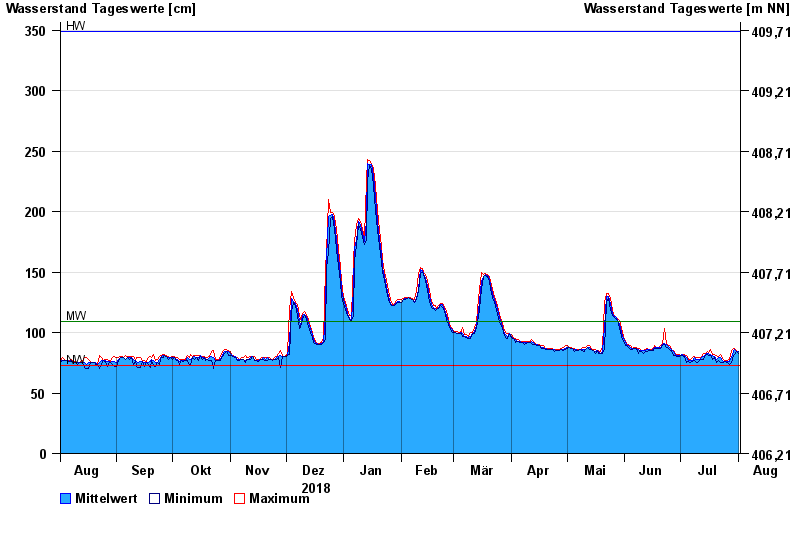
- Chart of year

Chart of year Treuchtlingen / Altmühl
Waterlevel from 02.08.2018 to 01.08.2019
| Date | Mean value [cm] | Maximum [cm] | Minimum [cm] |
|---|---|---|---|
| 01.08.2019 | 84 | 84 | 83 |
| 31.07.2019 | 84 | 85 | 84 |
| 30.07.2019 | 86 | 87 | 82 |
| 29.07.2019 | 84 | 87 | 81 |
| 28.07.2019 | 79 | 85 | 75 |
| 27.07.2019 | 76 | 78 | 74 |
| 26.07.2019 | 76 | 77 | 75 |
© Bayerisches Landesamt für Umwelt 2024