
- Start >
- Rivers >
- Waterlevel >
- Obere Donau >
- Treuchtlingen >
- Chart of year

Chart of year Treuchtlingen / Altmühl
Waterlevel from 01.01.2017 to 31.12.2017
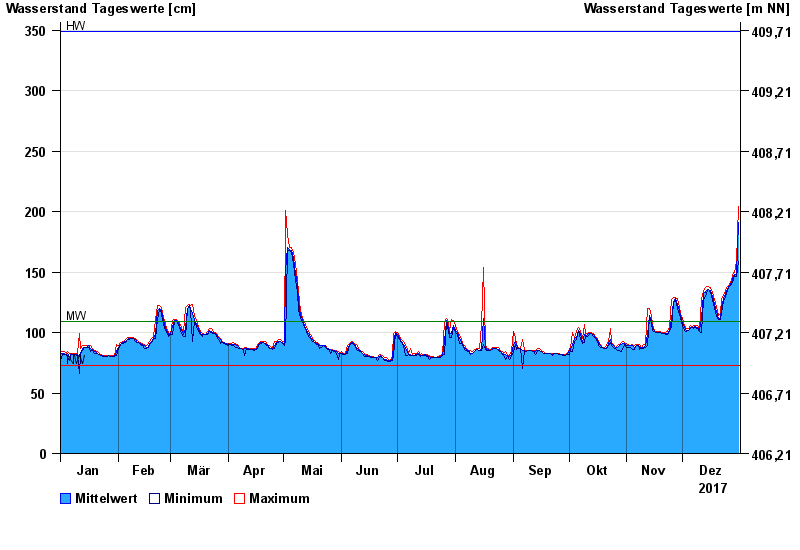
| Date | Mean value [cm] | Maximum [cm] | Minimum [cm] |
|---|---|---|---|
| 31.12.2017 | 191 | 204 | 159 |
| 30.12.2017 | 148 | 159 | 146 |
| 29.12.2017 | 148 | 150 | 147 |
| 28.12.2017 | 147 | 150 | 144 |
| 27.12.2017 | 141 | 144 | 140 |
| 26.12.2017 | 139 | 140 | 138 |
| 25.12.2017 | 136 | 138 | 135 |
© Bayerisches Landesamt für Umwelt 2024