
- Start >
- Rivers >
- Waterlevel >
- Obere Donau >
- Thann >
- Chart of total period

Chart of total period Thann / Altmühl
Waterlevel from 01.11.1980 to 26.04.2024
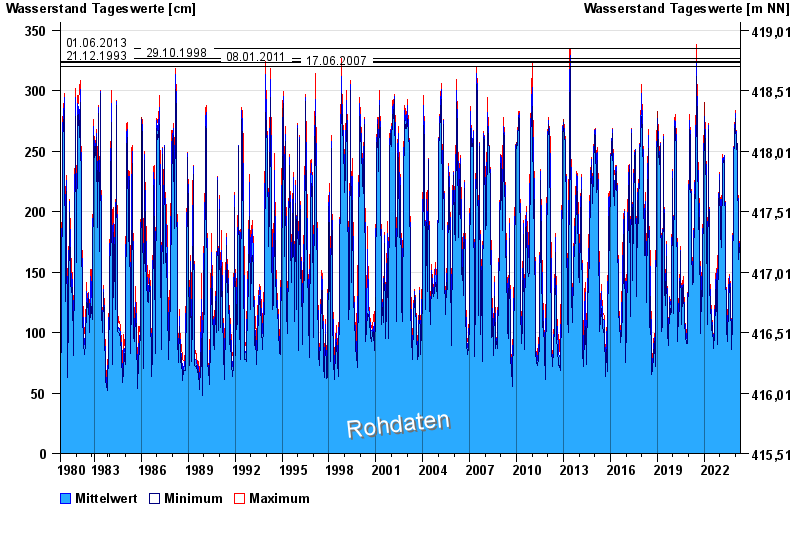
- 01.06.2013 Wasserstand: 335 cm
- 29.10.1998 Wasserstand: 327 cm
- 21.12.1993 Wasserstand: 324 cm
- 08.01.2011 Wasserstand: 323 cm
- 17.06.2007 Wasserstand: 320 cm
| Date | Mean value [cm] | Maximum [cm] | Minimum [cm] |
|---|---|---|---|
| 26.04.2024 | 134 | 136 | 133 |
| 25.04.2024 | 139 | 143 | 136 |
| 24.04.2024 | 149 | 156 | 143 |
| 23.04.2024 | 161 | 165 | 156 |
| 22.04.2024 | 163 | 165 | 160 |
| 21.04.2024 | 153 | 160 | 145 |
| 20.04.2024 | 138 | 145 | 130 |
© Bayerisches Landesamt für Umwelt 2024