
- Start >
- Rivers >
- Waterlevel >
- Obere Donau >
- Seemannsmühle >
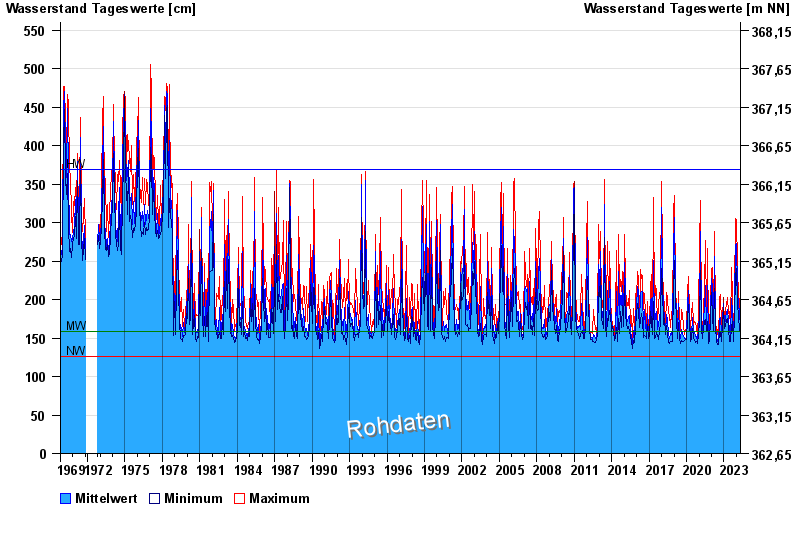
- Chart of total period

Chart of total period Seemannsmühle / Schwäbische Rezat
Waterlevel from 01.11.1969 to 27.04.2024
| Date | Mean value [cm] | Maximum [cm] | Minimum [cm] |
|---|---|---|---|
| 27.04.2024 | 150 | 150 | 149 |
| 26.04.2024 | 150 | 152 | 149 |
| 25.04.2024 | 151 | 152 | 151 |
| 24.04.2024 | 152 | 154 | 151 |
| 23.04.2024 | 153 | 155 | 152 |
| 22.04.2024 | 156 | 162 | 149 |
| 21.04.2024 | 157 | 163 | 148 |
© Bayerisches Landesamt für Umwelt 2024