
- Start >
- Rivers >
- Waterlevel >
- Obere Donau >
- Roth Kläranlage >
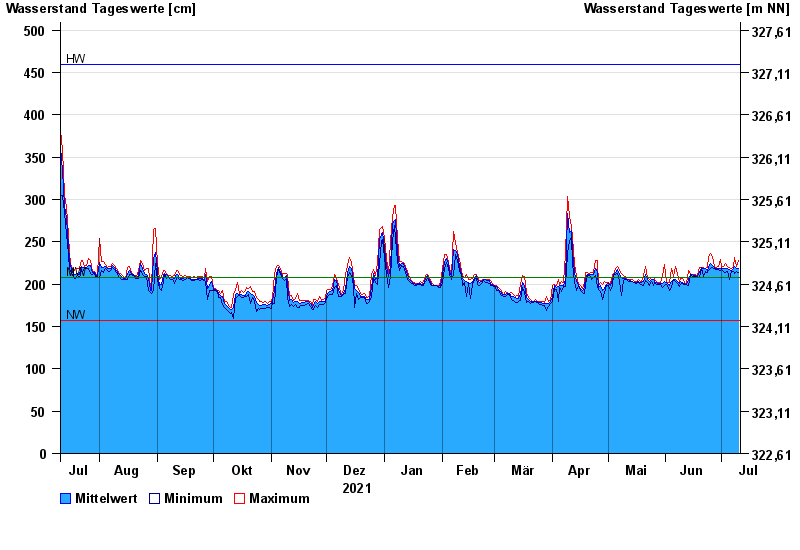
- Chart of year

Chart of year Roth Kläranlage / Rednitz
Waterlevel from 11.07.2021 to 10.07.2022
| Date | Mean value [cm] | Maximum [cm] | Minimum [cm] |
|---|---|---|---|
| 10.07.2022 | 218 | 228 | 214 |
| 09.07.2022 | 218 | 221 | 215 |
| 08.07.2022 | 221 | 231 | 213 |
| 07.07.2022 | 218 | 221 | 215 |
| 06.07.2022 | 216 | 218 | 215 |
| 05.07.2022 | 217 | 220 | 206 |
| 04.07.2022 | 218 | 221 | 215 |
© Bayerisches Landesamt für Umwelt 2024