
- Start >
- Rivers >
- Waterlevel >
- Obere Donau >
- Roth Kläranlage >
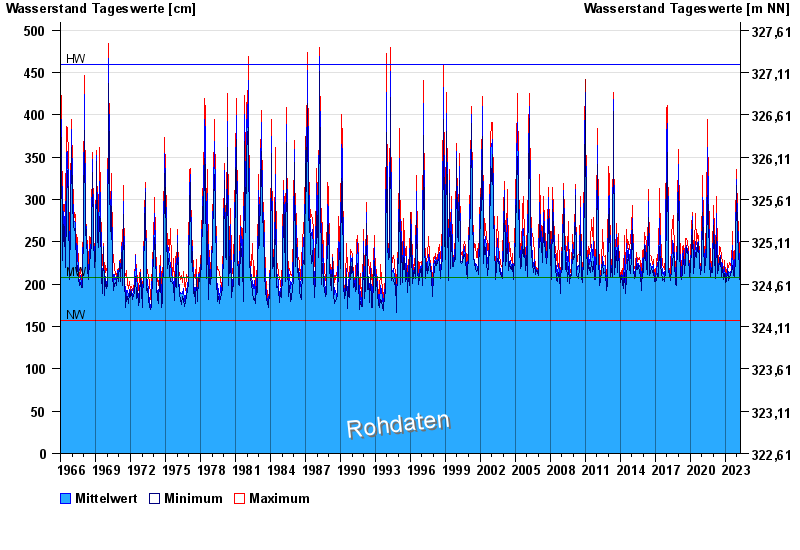
- Chart of total period

Chart of total period Roth Kläranlage / Rednitz
Waterlevel from 01.01.1966 to 25.04.2024
| Date | Mean value [cm] | Maximum [cm] | Minimum [cm] |
|---|---|---|---|
| 25.04.2024 | 186 | 187 | 184 |
| 24.04.2024 | 188 | 190 | 186 |
| 23.04.2024 | 191 | 196 | 182 |
| 22.04.2024 | 196 | 200 | 193 |
| 21.04.2024 | 196 | 200 | 193 |
| 20.04.2024 | 193 | 196 | 192 |
| 19.04.2024 | 187 | 192 | 183 |
© Bayerisches Landesamt für Umwelt 2024