
- Start >
- Rivers >
- Waterlevel >
- Obere Donau >
- Regensburg Eiserne Brücke >
- Chart of total period

Chart of total period Regensburg Eiserne Brücke / Donau
Waterlevel from 01.11.1969 to 27.04.2024
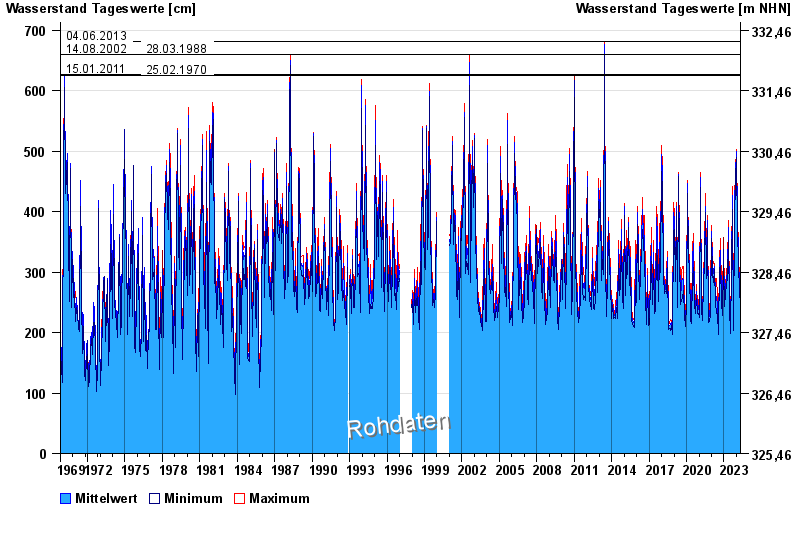
- 04.06.2013 Wasserstand: 682 cm
- 14.08.2002 Wasserstand: 660 cm
- 28.03.1988 Wasserstand: 659 cm
- 15.01.2011 Wasserstand: 627 cm
- 25.02.1970 Wasserstand: 625 cm
| Date | Mean value [cm] | Maximum [cm] | Minimum [cm] |
|---|---|---|---|
| 27.04.2024 | 239 | 240 | 239 |
| 26.04.2024 | 239 | 244 | 234 |
| 25.04.2024 | 240 | 247 | 234 |
| 24.04.2024 | 245 | 251 | 239 |
| 23.04.2024 | 261 | 271 | 251 |
| 22.04.2024 | 270 | 273 | 267 |
| 21.04.2024 | 274 | 281 | 265 |
© Bayerisches Landesamt für Umwelt 2024