
- Start >
- Rivers >
- Waterlevel >
- Obere Donau >
- Pfaffenhofen >
- Chart of total period

Chart of total period Pfaffenhofen / Zusam
Waterlevel from 01.11.1969 to 01.05.2024
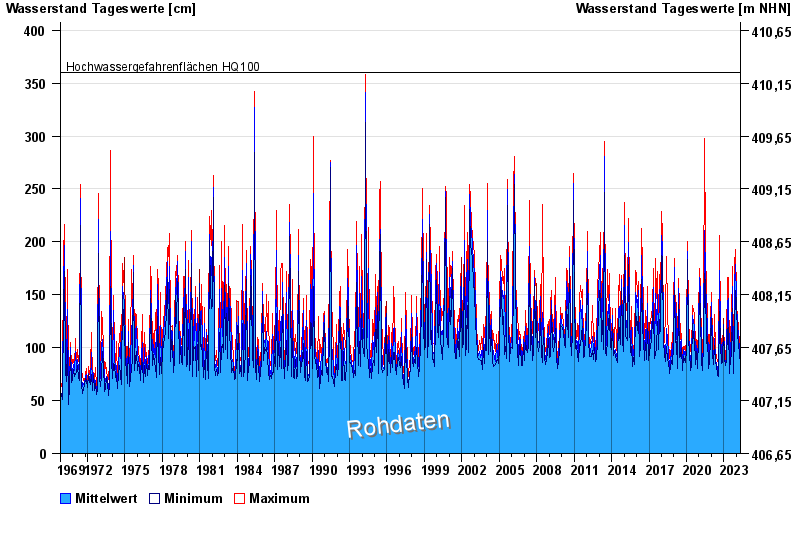
- Hochwassergefahrenfläche HQ100 360 cm
| Date | Mean value [cm] | Maximum [cm] | Minimum [cm] |
|---|---|---|---|
| 01.05.2024 | 80 | 88 | 78 |
| 30.04.2024 | 80 | 81 | 79 |
| 29.04.2024 | 80 | 81 | 80 |
| 28.04.2024 | 82 | 83 | 81 |
| 27.04.2024 | 82 | 83 | 82 |
| 26.04.2024 | 84 | 85 | 83 |
| 25.04.2024 | 85 | 85 | 84 |
© Bayerisches Landesamt für Umwelt 2024