
- Start >
- Rivers >
- Waterlevel >
- Obere Donau >
- Oberndorf >
- Chart of year

Chart of year Oberndorf / Donau
Waterlevel from 26.05.2020 to 25.05.2021
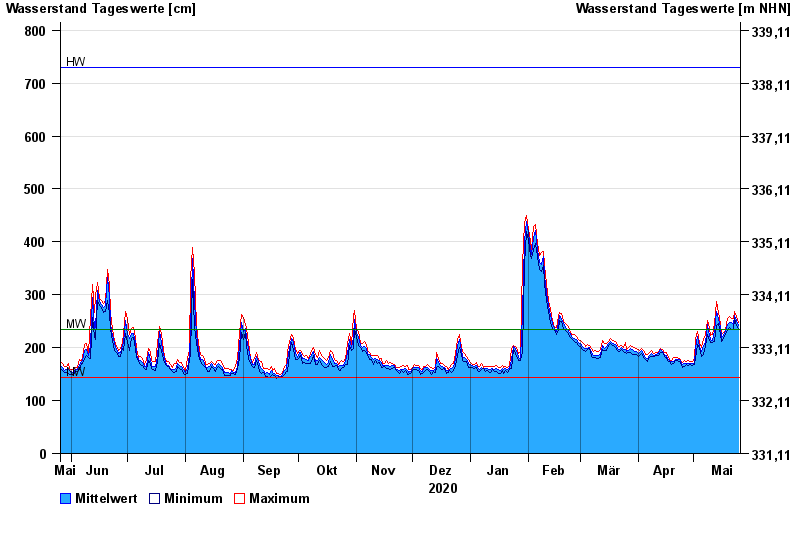
| Date | Mean value [cm] | Maximum [cm] | Minimum [cm] |
|---|---|---|---|
| 25.05.2021 | 242 | 247 | 235 |
| 24.05.2021 | 251 | 258 | 242 |
| 23.05.2021 | 261 | 268 | 256 |
| 22.05.2021 | 243 | 256 | 235 |
| 21.05.2021 | 247 | 256 | 235 |
| 20.05.2021 | 247 | 258 | 239 |
| 19.05.2021 | 243 | 255 | 232 |
© Bayerisches Landesamt für Umwelt 2024