
- Start >
- Rivers >
- Waterlevel >
- Obere Donau >
- Oberndorf >
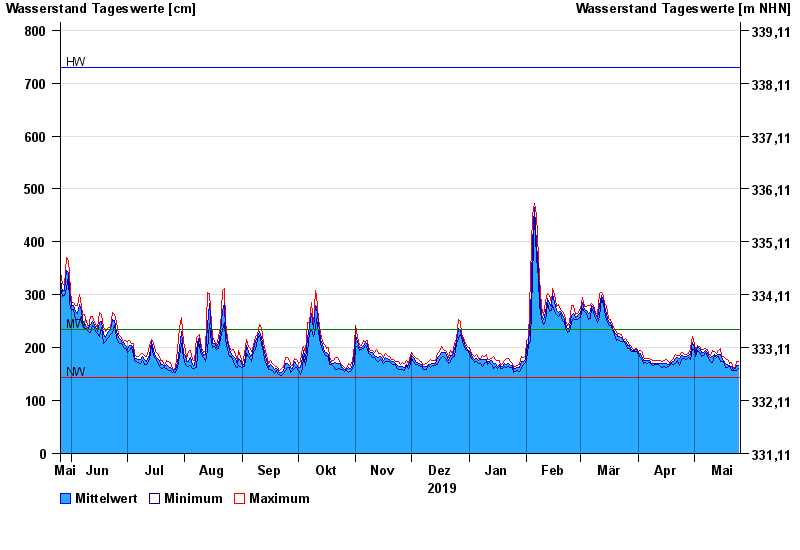
- Chart of year

Chart of year Oberndorf / Donau
Waterlevel from 26.05.2019 to 25.05.2020
| Date | Mean value [cm] | Maximum [cm] | Minimum [cm] |
|---|---|---|---|
| 25.05.2020 | 167 | 174 | 161 |
| 24.05.2020 | 167 | 174 | 156 |
| 23.05.2020 | 160 | 163 | 157 |
| 22.05.2020 | 158 | 161 | 156 |
| 21.05.2020 | 164 | 172 | 157 |
| 20.05.2020 | 166 | 170 | 164 |
| 19.05.2020 | 169 | 178 | 163 |
© Bayerisches Landesamt für Umwelt 2024