
- Start >
- Rivers >
- Waterlevel >
- Obere Donau >
- Oberndorf >
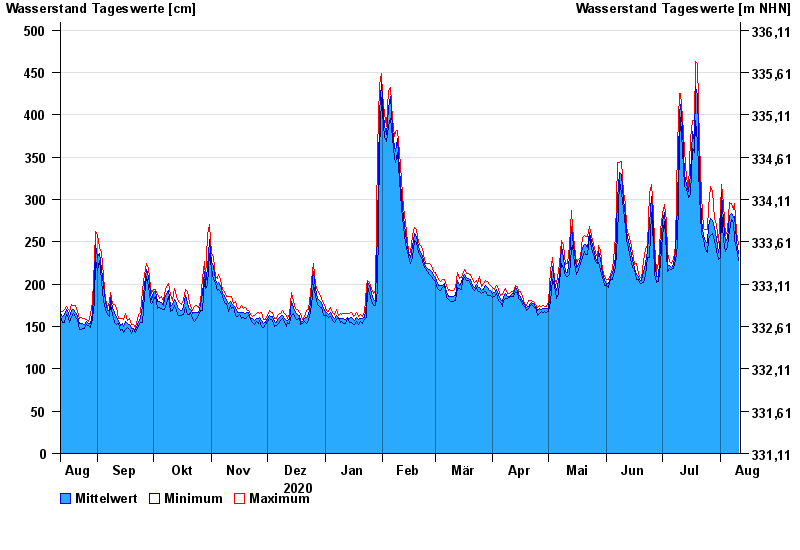
- Chart of year

Chart of year Oberndorf / Donau
Waterlevel from 12.08.2020 to 11.08.2021
- 24.05.1999 Wasserstand: 730 cm
- 04.06.2013 Wasserstand: 684 cm
- 26.08.2005 Wasserstand: 664 cm
- 16.04.1994 Wasserstand: 641 cm
- 14.08.2002 Wasserstand: 630 cm
| Date | Mean value [cm] | Maximum [cm] | Minimum [cm] |
|---|---|---|---|
| 11.08.2021 | 236 | 247 | 228 |
| 10.08.2021 | 252 | 262 | 242 |
| 09.08.2021 | 280 | 295 | 253 |
| 08.08.2021 | 279 | 288 | 272 |
| 07.08.2021 | 284 | 295 | 276 |
| 06.08.2021 | 281 | 296 | 263 |
| 05.08.2021 | 254 | 263 | 245 |
© Bayerisches Landesamt für Umwelt 2024