
- Start >
- Rivers >
- Waterlevel >
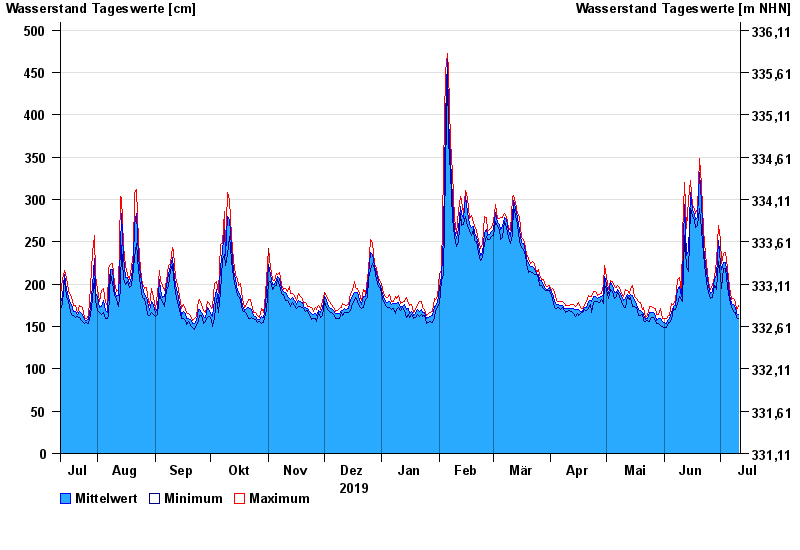
- Obere Donau >
- Oberndorf >
- Chart of year

Chart of year Oberndorf / Donau
Waterlevel from 12.07.2019 to 11.07.2020
| Date | Mean value [cm] | Maximum [cm] | Minimum [cm] |
|---|---|---|---|
| 11.07.2020 | 164 | 175 | 159 |
| 10.07.2020 | 165 | 169 | 161 |
| 09.07.2020 | 172 | 180 | 167 |
| 08.07.2020 | 176 | 183 | 168 |
| 07.07.2020 | 177 | 182 | 173 |
| 06.07.2020 | 188 | 197 | 182 |
| 05.07.2020 | 210 | 219 | 197 |
© Bayerisches Landesamt für Umwelt 2024