
- Start >
- Rivers >
- Waterlevel >
- Obere Donau >
- Oberndorf >
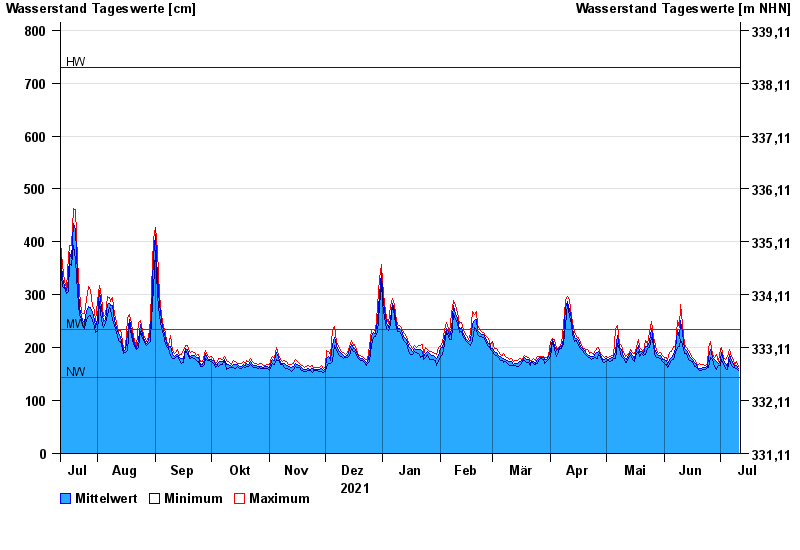
- Chart of year

Chart of year Oberndorf / Donau
Waterlevel from 12.07.2021 to 11.07.2022
| Date | Mean value [cm] | Maximum [cm] | Minimum [cm] |
|---|---|---|---|
| 11.07.2022 | 160 | 164 | 157 |
| 10.07.2022 | 167 | 173 | 161 |
| 09.07.2022 | 165 | 168 | 163 |
| 08.07.2022 | 169 | 177 | 163 |
| 07.07.2022 | 175 | 183 | 167 |
| 06.07.2022 | 187 | 196 | 178 |
| 05.07.2022 | 165 | 183 | 158 |
© Bayerisches Landesamt für Umwelt 2024