
- Start >
- Rivers >
- Waterlevel >
- Obere Donau >
- Obermenzing >
- Chart of month

Chart of month Obermenzing / Würm
Waterlevel from 02.08.2021 to 01.09.2021
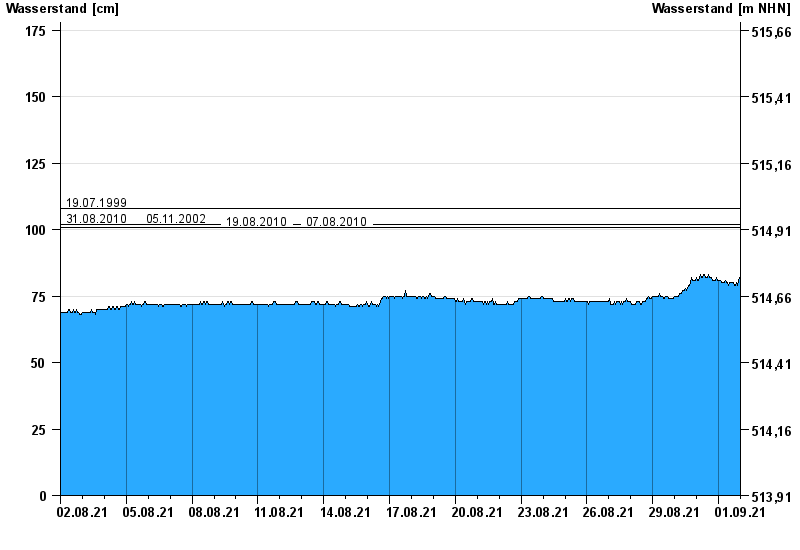
- 19.07.1999 Wasserstand: 108 cm
- 31.08.2010 Wasserstand: 102 cm
- 05.11.2002 Wasserstand: 102 cm
- 19.08.2010 Wasserstand: 101 cm
- 07.08.2010 Wasserstand: 101 cm
| Date | Waterlevel [cm] |
|---|---|
| 02.09.2021 00:45 | 78 |
| 02.09.2021 00:30 | 78 |
| 02.09.2021 00:15 | 76 |
| 02.09.2021 00:00 | 73 |
| 01.09.2021 23:45 | 78 |
| 01.09.2021 23:30 | 81 |
| 01.09.2021 23:15 | 82 |
© Bayerisches Landesamt für Umwelt 2025