
- Start >
- Rivers >
- Waterlevel >
- Obere Donau >
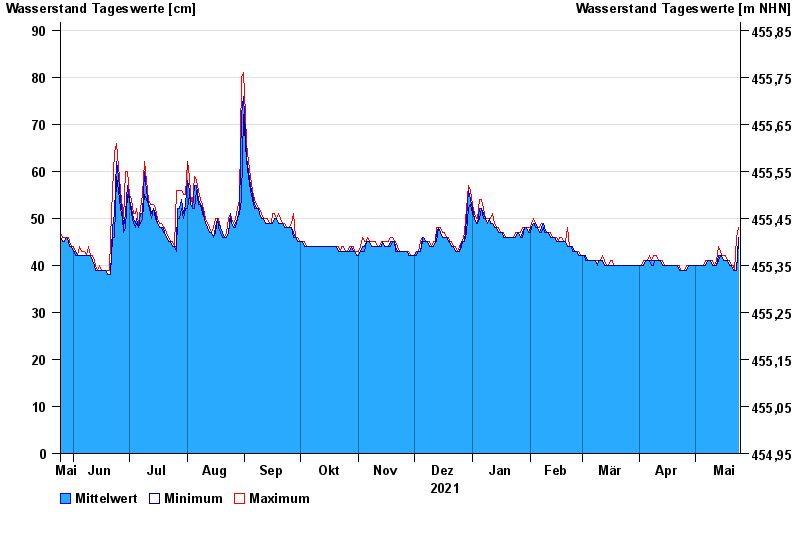
- Oberding >
- Chart of year

Chart of year Oberding / Gfällach
Waterlevel from 25.05.2021 to 24.05.2022
- 03.06.2013 Wasserstand: 121 cm
- 18.07.1974 Wasserstand: 120 cm
- 07.06.1995 Wasserstand: 116 cm
- 31.07.1977 Wasserstand: 114 cm
- 08.08.1978 Wasserstand: 113 cm
| Date | Mean value [cm] | Maximum [cm] | Minimum [cm] |
|---|---|---|---|
| 24.05.2022 | 46 | 48 | 45 |
| 23.05.2022 | 39 | 46 | 39 |
| 22.05.2022 | 39 | 39 | 39 |
| 21.05.2022 | 39 | 40 | 39 |
| 20.05.2022 | 40 | 40 | 40 |
| 19.05.2022 | 40 | 41 | 40 |
| 18.05.2022 | 41 | 41 | 41 |
© Bayerisches Landesamt für Umwelt 2024