
- Start >
- Rivers >
- Waterlevel >
- Obere Donau >
- Neumühle >
- Chart of month

Chart of month Neumühle / Rednitz
Waterlevel from 01.02.2020 to 02.03.2020
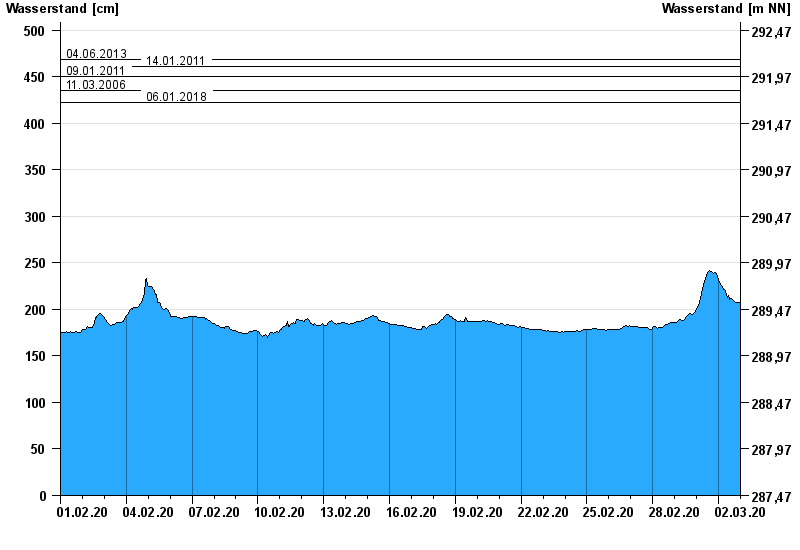
- 04.06.2013 Wasserstand: 469 cm
- 14.01.2011 Wasserstand: 461 cm
- 09.01.2011 Wasserstand: 450 cm
- 11.03.2006 Wasserstand: 436 cm
- 06.01.2018 Wasserstand: 423 cm
| Date | Waterlevel [cm] |
|---|---|
| 02.03.2020 23:45 | 207 |
| 02.03.2020 23:30 | 207 |
| 02.03.2020 23:15 | 207 |
| 02.03.2020 23:00 | 207 |
| 02.03.2020 22:45 | 207 |
| 02.03.2020 22:30 | 207 |
| 02.03.2020 22:15 | 207 |
© Bayerisches Landesamt für Umwelt 2024