
- Start >
- Rivers >
- Waterlevel >
- Obere Donau >
- Mühlried >
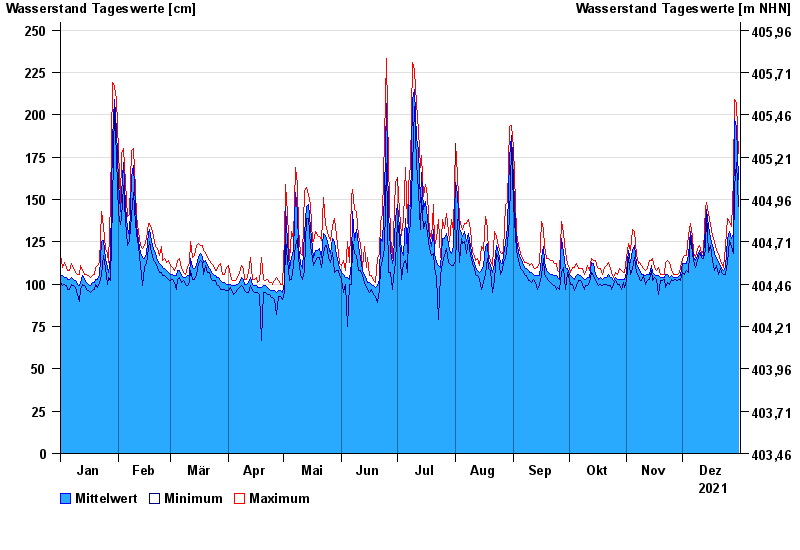
- Chart of year

Chart of year Mühlried / Paar
Waterlevel from 01.01.2021 to 31.12.2021
- 03.06.2013 Wasserstand: 348 cm
- 14.04.1994 Wasserstand: 340 cm
- 10.03.2006 Wasserstand: 337 cm
- 13.08.2002 Wasserstand: 324 cm
- 23.05.1999 Wasserstand: 324 cm
| Date | Mean value [cm] | Maximum [cm] | Minimum [cm] |
|---|---|---|---|
| 31.12.2021 | 162 | 177 | 146 |
| 30.12.2021 | 193 | 207 | 172 |
| 29.12.2021 | 197 | 209 | 157 |
| 28.12.2021 | 130 | 162 | 118 |
| 27.12.2021 | 127 | 134 | 122 |
| 26.12.2021 | 131 | 137 | 126 |
| 25.12.2021 | 127 | 139 | 113 |
© Bayerisches Landesamt für Umwelt 2024