
- Start >
- Rivers >
- Waterlevel >
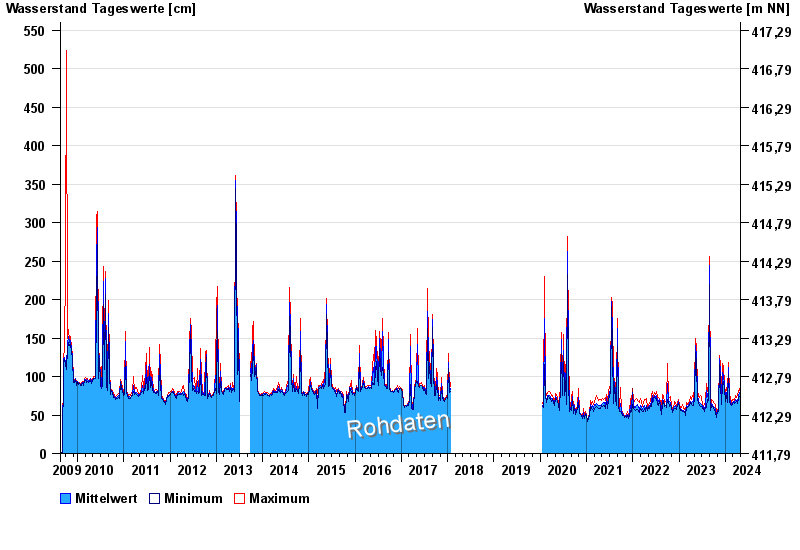
- Obere Donau >
- Moosburg >
- Chart of total period

Chart of total period Moosburg / Isar
Waterlevel from 19.08.2009 to 29.04.2024
| Date | Mean value [cm] | Maximum [cm] | Minimum [cm] |
|---|---|---|---|
| 29.04.2024 | 72 | 73 | 71 |
| 28.04.2024 | 71 | 77 | 68 |
| 27.04.2024 | 73 | 77 | 69 |
| 26.04.2024 | 72 | 79 | 70 |
| 25.04.2024 | 75 | 79 | 72 |
| 24.04.2024 | 74 | 79 | 73 |
| 23.04.2024 | 79 | 84 | 74 |
© Bayerisches Landesamt für Umwelt 2024