
- Start >
- Rivers >
- Waterlevel >
- Obere Donau >
- Mettendorf >
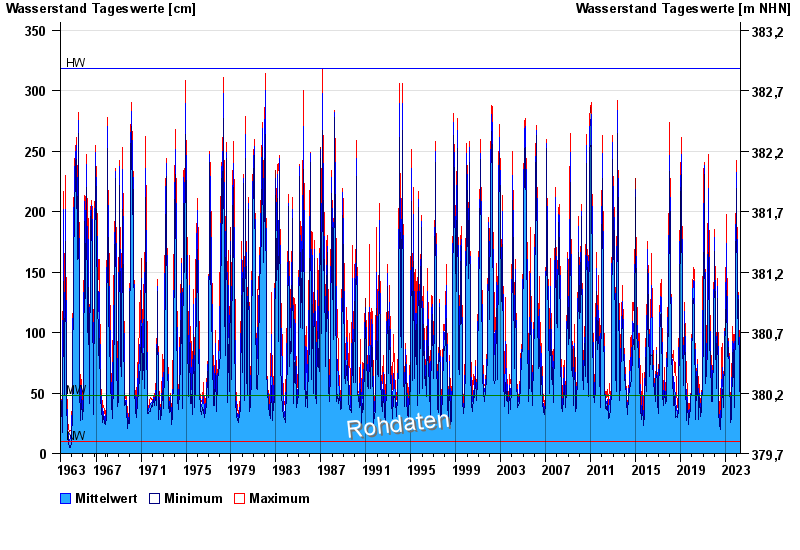
- Chart of total period

Chart of total period Mettendorf / Schwarzach
Waterlevel from 01.11.1963 to 29.04.2024
| Date | Mean value [cm] | Maximum [cm] | Minimum [cm] |
|---|---|---|---|
| 29.04.2024 | 33 | 34 | 29 |
| 28.04.2024 | 35 | 36 | 34 |
| 27.04.2024 | 37 | 38 | 36 |
| 26.04.2024 | 39 | 40 | 38 |
| 25.04.2024 | 41 | 42 | 40 |
| 24.04.2024 | 45 | 49 | 42 |
| 23.04.2024 | 54 | 56 | 50 |
© Bayerisches Landesamt für Umwelt 2024