
- Start >
- Rivers >
- Waterlevel >
- Obere Donau >
- Langengeisling >
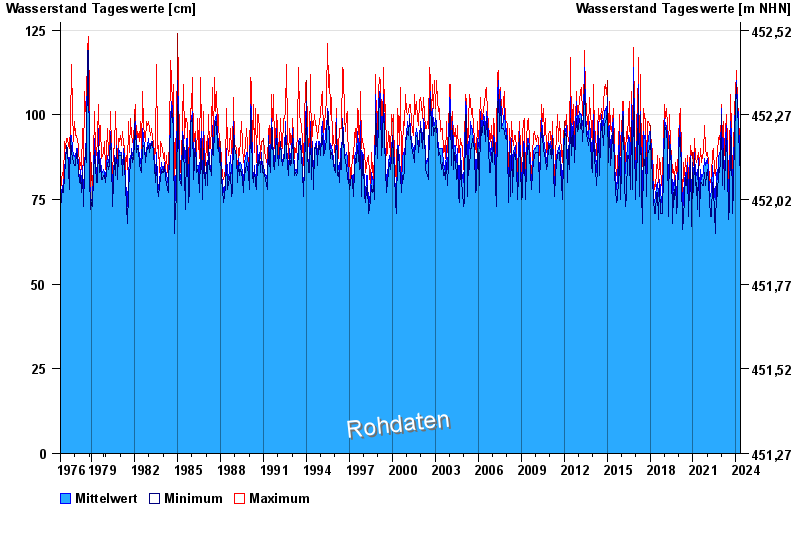
- Chart of total period

Chart of total period Langengeisling / Sempt
Waterlevel from 01.11.1976 to 26.04.2024
| Date | Mean value [cm] | Maximum [cm] | Minimum [cm] |
|---|---|---|---|
| 26.04.2024 | 83 | 84 | 79 |
| 25.04.2024 | 82 | 86 | 77 |
| 24.04.2024 | 86 | 88 | 85 |
| 23.04.2024 | 87 | 90 | 85 |
| 22.04.2024 | 90 | 95 | 87 |
| 21.04.2024 | 89 | 94 | 87 |
| 20.04.2024 | 86 | 88 | 84 |
© Bayerisches Landesamt für Umwelt 2024