
- Start >
- Rivers >
- Waterlevel >
- Obere Donau >
- Kinding KA >
- Chart of total period

Chart of total period Kinding KA / Altmühl
Waterlevel from 02.08.2007 to 08.05.2024
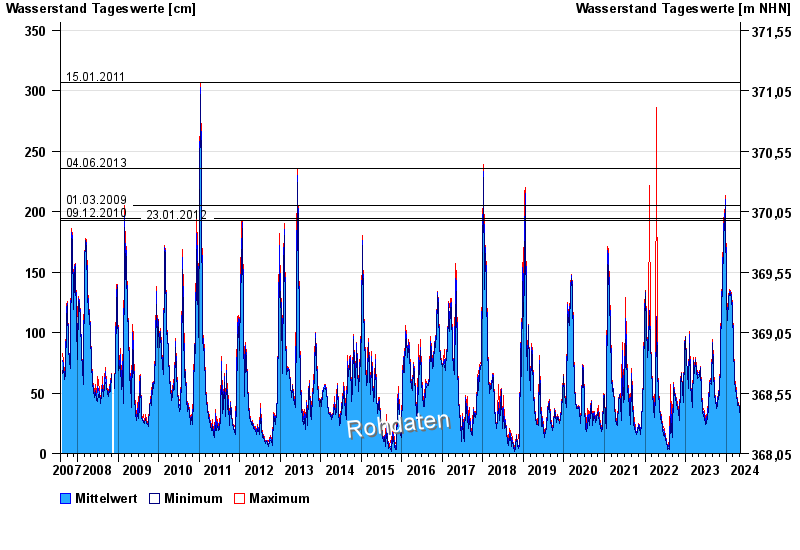
- 15.01.2011 Wasserstand: 307 cm
- 04.06.2013 Wasserstand: 236 cm
- 01.03.2009 Wasserstand: 205 cm
- 09.12.2010 Wasserstand: 194 cm
- 23.01.2012 Wasserstand: 193 cm
| Date | Mean value [cm] | Maximum [cm] | Minimum [cm] |
|---|---|---|---|
| 08.05.2024 | 32 | 32 | 31 |
| 07.05.2024 | 32 | 33 | 31 |
| 06.05.2024 | 29 | 31 | 27 |
| 05.05.2024 | 25 | 27 | 25 |
| 04.05.2024 | 26 | 26 | 25 |
| 03.05.2024 | 26 | 27 | 26 |
| 02.05.2024 | 27 | 27 | 26 |
© Bayerisches Landesamt für Umwelt 2024