
- Start >
- Rivers >
- Waterlevel >
- Obere Donau >
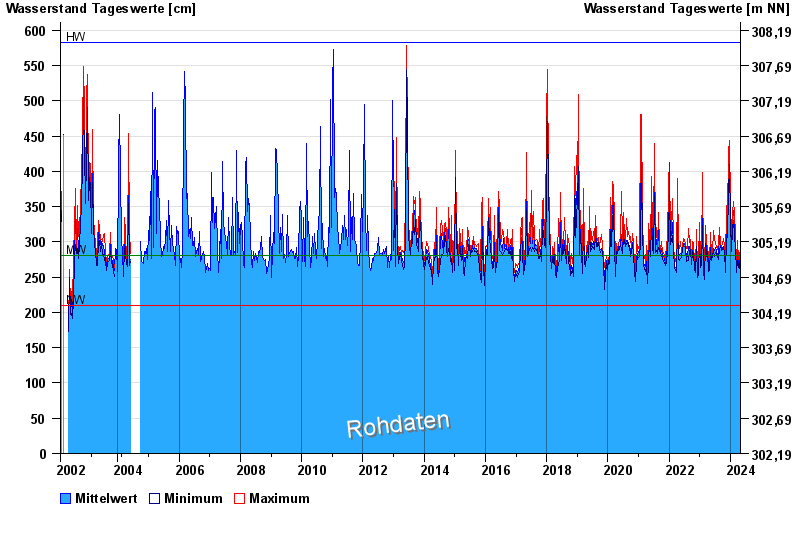
- Katzwang >
- Chart of total period

Chart of total period Katzwang / Rednitz
Waterlevel from 15.02.2002 to 29.04.2024
| Date | Mean value [cm] | Maximum [cm] | Minimum [cm] |
|---|---|---|---|
| 29.04.2024 | 244 | 244 | 244 |
| 28.04.2024 | 245 | 247 | 244 |
| 27.04.2024 | 248 | 262 | 216 |
| 26.04.2024 | 252 | 254 | 251 |
| 25.04.2024 | 255 | 255 | 253 |
| 24.04.2024 | 257 | 263 | 237 |
| 23.04.2024 | 264 | 269 | 259 |
© Bayerisches Landesamt für Umwelt 2024