
- Start >
- Rivers >
- Waterlevel >
- Obere Donau >
- Hasberg >
- Chart of year

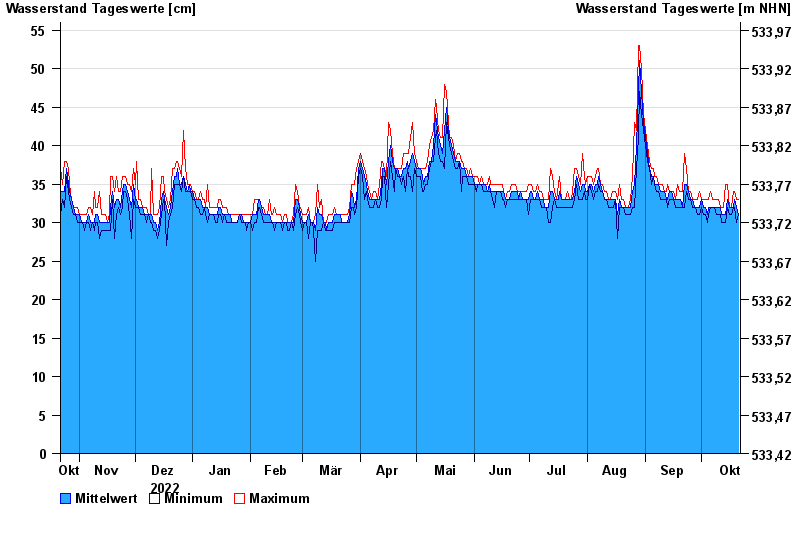
Chart of year Hasberg / Östliche Mindel
Waterlevel from 22.10.2022 to 21.10.2023
- 07.06.2002 Wasserstand: 120 cm
- 08.06.1971 Wasserstand: 102 cm
- 11.08.2002 Wasserstand: 100 cm
- 23.08.2005 Wasserstand: 97 cm
- 14.04.1994 Wasserstand: 95 cm
| Date | Mean value [cm] | Maximum [cm] | Minimum [cm] |
|---|---|---|---|
| 21.10.2023 | 31 | 33 | 31 |
| 20.10.2023 | 32 | 33 | 30 |
| 19.10.2023 | 33 | 34 | 32 |
| 18.10.2023 | 32 | 34 | 32 |
| 17.10.2023 | 32 | 32 | 31 |
| 16.10.2023 | 32 | 32 | 31 |
| 15.10.2023 | 33 | 35 | 32 |
© Bayerisches Landesamt für Umwelt 2024